
As a Google Data Studio nerd, I get questions about it all the time. Sometimes these are complicated technical questions. But the most common questions I get are around how to get started with Google Data Studio. And to be honest, I haven’t really known how to answer!
I asked on Twitter and got some responses, but still didn’t feel like there was a singular source of awesome GDS resources that I could point people to.
What are everyone’s favorite beginner resources for Google Data Studio? I get this question a lot and would love to point people to a helpful place!
— Rachel Anderson (@rachelleighrva) September 10, 2020
So I’ve compiled how to get started with Google Data Studio, how to continue learning, and some advanced use cases for GDS – with plenty of resources at every step. So get ready to learn!
How To Get Started with Google Data Studio
If you’ve never used Google Data Studio before, I’d recommend starting by watching others use it, completing the GDS Google’s Analytics academy course, and adjusting settings in view mode of reports.
Watching Others Use GDS
Whether you’re sharing a GDS dashboard with a client for the first time or entering the tool for the first time yourself, it is extremely helpful to have someone walk you through the dashboard. I once shared a 7-page dashboard with a client who didn’t realize that there were more pages after the first page!
If you know someone who is familiar with Google Data Studio, ask them to walk you through a few of their reports so that you can familiarize yourself with the types of visualizations and capabilities of GDS. If you don’t know anyone with GDS skills, there are some great youtube videos that will help you start to familiarize yourself with the look and feel of GDS.
Google Analytics Academy GDS Course
Once you’re familiar with how the platform looks, it’s time to learn how to create and share dashboards yourself. A valuable free resource is the Google Analytics Academy Google Data Studio course.
In addition to teaching you the basics of creating dashboards, this course walks you through how to share dashboards with others while keeping your data safe. When I started with GDS, sharing permissions for dashboards and data sources really confused me and this course helped answer my questions.
Interacting with Dashboards
Another technique that is helpful to familiarize yourself with GDS is interacting with completed dashboards. Try adjusting dates, filters, and sliders to see how they change the data on the page. There are plenty of dashboards with open access online where you can adjust filters.
Some you may find useful are:
- Example Dashboard from DeepCrawl
- Hannah Rampton’s Google Search Console GDS Dashboard
- Aleyda Solis’s Google Search Console Dashboard with Segments
Creating Your Own Google Data Studio Dashboards
Using other people’s dashboards is nice, but eventually, you’ll likely want to create your own!
This can be a bit of a scary step, but will allow you to create dashboards that show exactly what you need and make you self-reliant! There are two methods I’d recommend to make this step easier for you. Start with pre-made dashboard templates and adjust them to fit your needs and using GDS connectors for tools that you are already familiar with are great places to start.
Adjusting Templates to Meet Your Needs
There is no shame in finding a template dashboard that you like and adjusting it to fit your needs. In fact, it’s one of the best ways to familiarize yourself with creating dashboards in GDS. Of course, if you’re planning to share the dashboard with others, make sure you give credit to the original creator!
Many template dashboards are built off of pre-made connectors for GDS and are only using a subset of the available metrics and dimensions within the connector. By making a copy of the dashboard and customizing metrics and charts, you’re able to begin experimenting with creating your own dashboard elements without the pressure of starting with a blank screen!
In addition to the dashboards mentioned above, here are some other helpful places to start:
- The Google Data Studio Report Gallery
- CrUX Dashboard
- Christina Brodzky’s Google Analytics dashboard
Use GDS Connectors You Already Understand
One way to make your adventure with GDS even more difficult is to start with data you don’t understand. Instead of becoming an expert in GDS and London crime data (an available public dataset!), start with data you already know. Some examples include Google Analytics, Google Search Console, DeepCrawl, or even your own data in Google Sheets.
To begin, open a new report in Google Data Studio and select “Add Data.” There will be a screen with many connector options. To find the one you’re looking for, you can search for it.
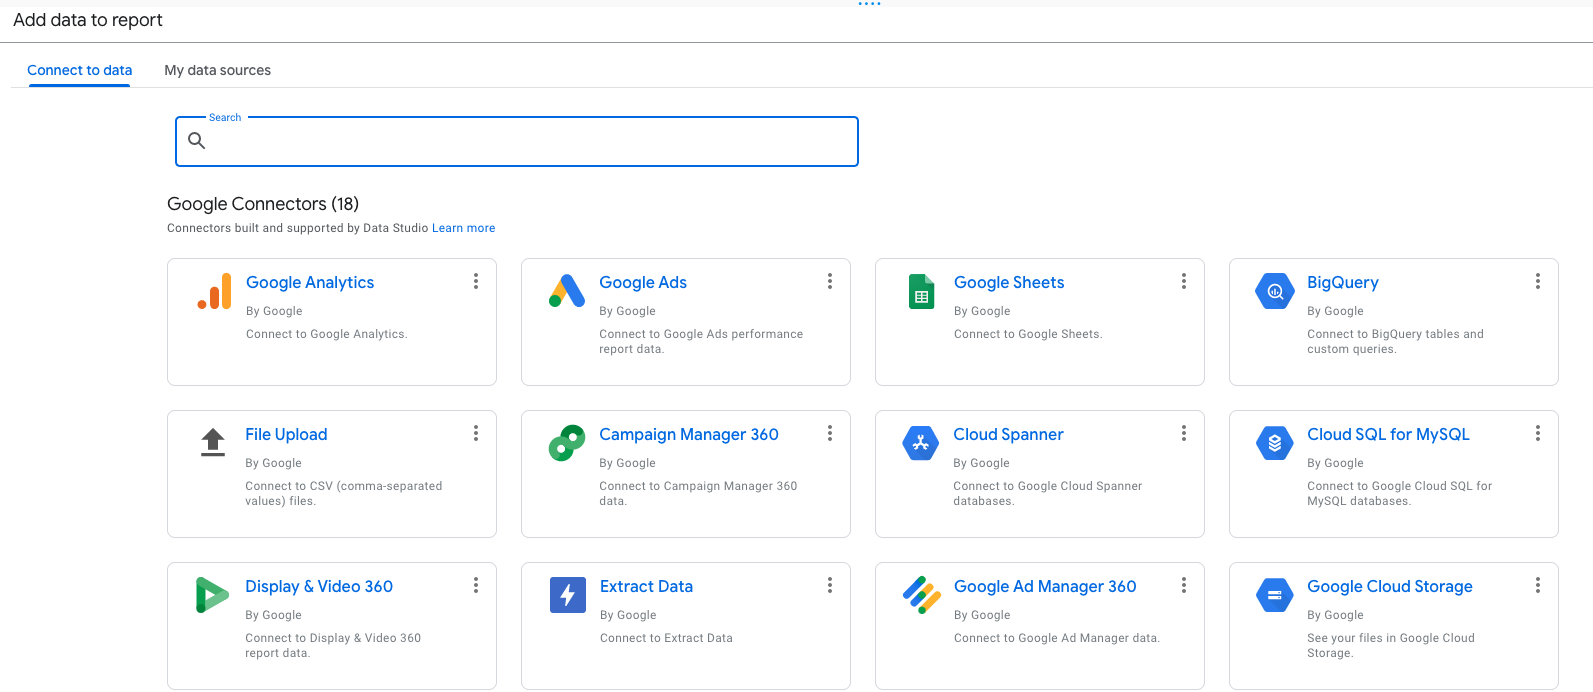
Depending on the data source you select, there may be verification options.
If you get hung up on any of these, there are plenty of resources available online to help walk you through step by step. I typically begin working with a new data source by creating a table in GDS to gain an understanding of how the data is related. If you are familiar with any of the data sources that I mentioned, here are a few ideas on how to get started.
Google Analytics
Some useful metrics to display for Google Analytics are:
- Sessions overtime using a time series chart (maybe broken down by channel or filtered to organic traffic only)
- Goal completions in the last 7 days vs previous 7 days using a scorecard
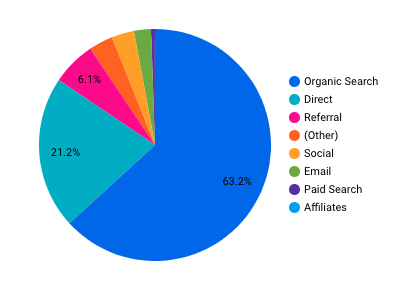
- Percent of traffic from each channel displayed in a pie chart
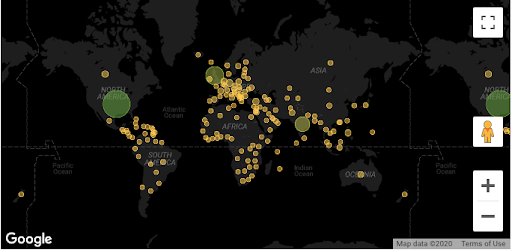
- What cities/states/regions your traffic came from using a Google Maps chart
Google Search Console
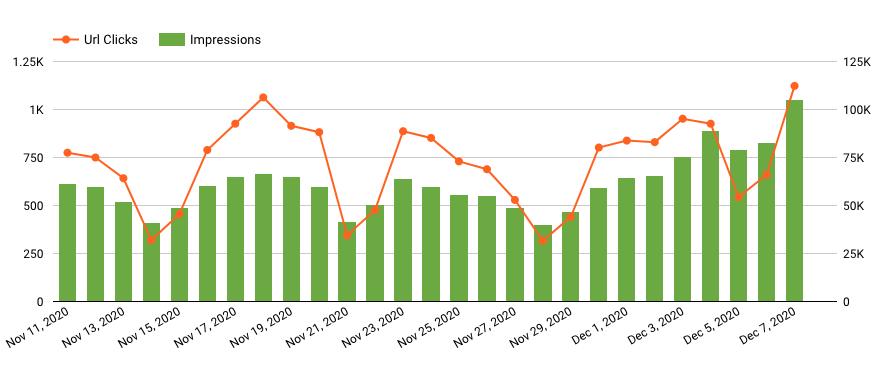
- Clicks and impressions over time using a time series chart (maybe using bars for impressions and lines for clicks with a separate right y-axis for impressions)
- Queries from the past month sorted by clicks using a table (try adding a comparison of last year)
- Top URLs from branded queries using a table plus a filter for branded queries
DeepCrawl
Using the DeepCrawl Data Studio Connector to create charts such as:
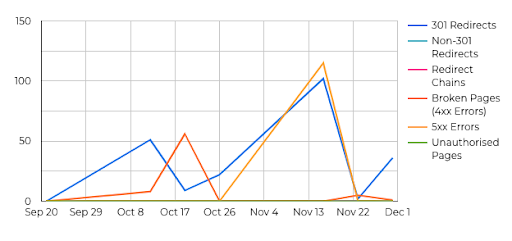
- HTTP status codes over time using a time series chart (bonus, add a segment filter to allow you to see them by segment)
- Top issues from the last crawl using a bar chart
- Pages missing title tags, duplicate titles, and missing meta descriptions over time using a time series chart
Advanced Google Data Studio Resources
Once you’re familiar with the process of creating your own dashboards with simple connectors, you’re ready to move on to more advanced dashboards. I’ll point out some more complicated GDS features, talk a bit about BigQuery, and share many of my favorite GDS resources today.
More Complicated GDS Features
GDS is a powerful tool with some extremely helpful features that are a bit more complicated to set up than the charts I’ve already mentioned. Some that I use frequently are blending data sources, creating new fields in data sources, making reports interactive, and adding data controls.
Data Controls
Data Controls allow the user to filter data within a report instead of having to create many versions of the same chart with different filters. Almost every dashboard I create includes a date range filter, which allows the user to change the date range of data.
Other uses are a filter that allows you to change the traffic source from Google Analytics, a filter that allows you to use REGEX to match queries from Google Search Console or a segment filter that allows you to see the HTTP status codes from a particular DeepCrawl project.
Data Blending
Data blending in GDS allows you to join separate datasets together for use in the same chart.
Use cases include joining multiple Google Analytics properties together to compare performance, joining a Google Sheet with product data with Google Analytics or Google Search Console, or even joining a Google Sheet with census data with GSC data to see performance of location pages.
Data blending uses a left outer join, which is important to understand for troubleshooting missing data.
Creating New Fields
Calculated fields allow you to create new fields within existing data sources by manipulating data that already exists in that data source. You can create these at the chart level or the entire data source level.
One of my favorite ways to use calculated fields is with CASE statements. For example, I could start with the character length of a title in my data source and use CASE statements to create distinctions for long titles, short titles, and missing titles that I could then use in charts. Claire Carlile uses them to clean up messy UTM parameters. There are tons of use cases for CASE statements and even more for calculated fields as a whole!
Making Reports Interactive
Chart interaction filters are cool! Instead of having static sections of data, you can click on a part of a report and have it update other content on the page.
For example, you could use this with a Google Maps chart to only show you sessions from a particular region. Drill-downs allow you to drill down into a particular report to get more specific data, so your chart could start with a monthly view of data and then let you drill-down into weekly or daily data.
Using BigQuery to Bring In Data Without a Native GDS Connector
BigQuery scared me to death when I first started using GDS because it’s part of the Cloud Console and doesn’t seem particularly user friendly from the start. What made me feel better about using the BigQuery connector is thinking of BigQuery as a way to pull in a giant Excel spreadsheet or Google Sheet. Because that’s what BigQuery is – a way to store really big tables of data.
If you want to visualize large datasets in Google Data Studio, storing the data in BigQuery and using the native BigQuery connector for GDS is an excellent option.
The Google Search Console API and the new Google Analytics 4 compatibility with BigQuery makes this option even more approachable. If you don’t have access to any data in BigQuery currently, there are also public datasets that are available to experiment (remember that London crime data I mentioned earlier). BigQuery has some associated storage and query costs that are quite low, and when you get started, they give you a $300 account credit.
If you’re wanting to get started with BigQuery and Google Data Studio there’s a Udemy course that helped me a ton. There are also plenty of fun projects out there where you can hone your data warehouse plus GDS skills (like this one for automating Google LightHouse reports).
Resources for Advanced GDS Learning and New Features
Google Data Studio releases updates regularly and the community is constantly coming up with new uses for them! So get your creativity flowing and make sure you’re on top of updates by following these individuals and groups.
Dashboarding Pros to Follow
I have learned a ton from following and interacting with people on Twitter. Some talented dashboard creators on Twitter that you should absolutely follow are:
- https://twitter.com/mim_djo
- https://twitter.com/MichaelHoweEly
- https://twitter.com/wissi_analytics
- https://twitter.com/tiltondata
- https://twitter.com/HannahRampton
- https://twitter.com/ralph_spandl
- https://twitter.com/noahlearner
- https://twitter.com/danaditomaso
- https://twitter.com/Helpfullee
You can also follow me for occasional GDS tweets and plenty of cat content
Other Google Data Studio Resources
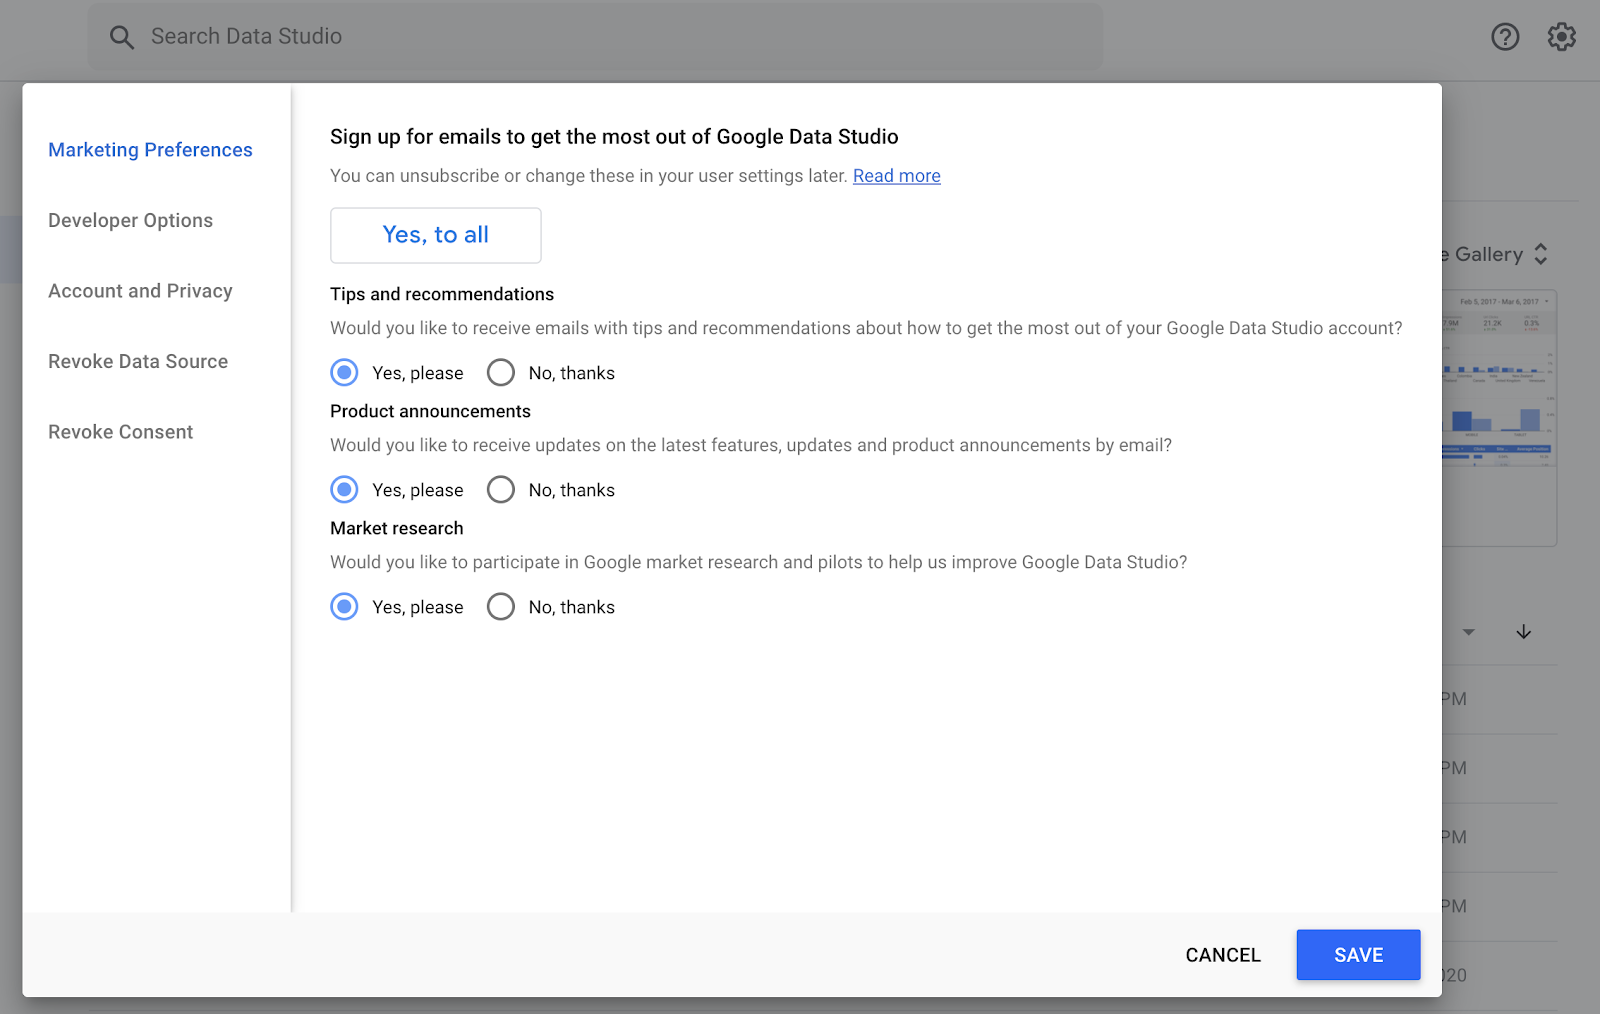
Follow the Google Analytics account, because new GDS features are frequently tweeted about from that profile. Speaking of new features, sign up for the GDS email list to get emails about product updates. How? Go to the GDS overview page, select the settings (gear) icon, and turn on the “yes please” option for marketing preferences.
Don’t want to wait for the emails? Well, there’s a “What’s New” page where GDS logs new feature updates!
Michael Howe-Ely has a fantastic blog where he walks through using features of GDS. In addition to the Twitter community, there is an excellent community of people using GDS on the Agency Automators slack group. Who knows, you might even get pulled into learning Python while you’re there!
That’s a Lot of Resources, Rachel
Yeah, I know! So no more excuses! No matter where you are in your journey with Google Data Studio, there is plenty more to learn and a great community of people to help you along. And if you have other valuable resources or individuals who I’ve overlooked in this article, please reach out – I’d love to connect!