
The SEO’s Guide to Google’s Core Web Vitals
At the end of May in 2020 Google announced they would be releasing a set of metrics called the Core Web Vitals. These are focused on speed, responsiveness, and the visual stability of a page.
These scores are set to be rolled into the core algorithm in 2021 and become a ranking signal. The SEO community has had a few months to get their head around these scores and it’s only going to become a bigger focus as we get closer to 2021.
This post will cover how SEOs can effectively audit, and provide insights to developers on how to improve these metrics.
Page speed up until today
Before we dive into what the Core Web Vitals are, it’s important to understand how performance has played a role in rankings up until today.
‘Speed Update’
This isn’t the first time that page speed has become a ranking signal. Previously, we saw the “Speed Update” released in July 2018. This represented the first time that Google took into account performance metrics with their rankings.
While this did create a large amount of interest when it was released, there were a few key elements which meant it didn’t have too large of an impact:
The “Speed Update,” as we’re calling it, will only affect pages that deliver the slowest experience to users and will only affect a small percentage of queries.
The update was only focused on the very slowest sites across mobile results. This impacted a tiny amount of queries so it never really materialized as something that could be holding a site’s ranking ability back.
The internet is heavy
Each year websites are becoming richer and more visual experiences which often coincides with a large reliance on JavaScript, video, and imagery. This inevitably leads to larger page weight and longer load times.
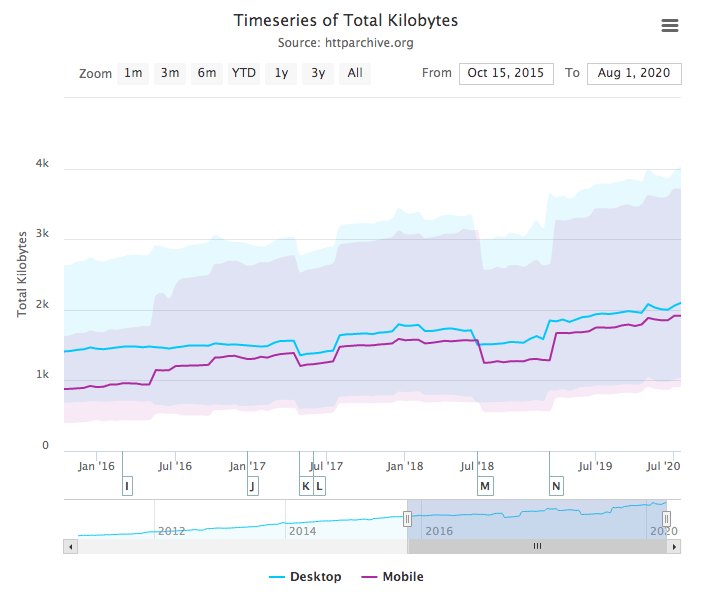
The above graph shows the growth in total page weight since 2016. Mobile websites have doubled in size (800kb to 2,000kb) and desktop versions have grown by over a third (1,400kb to 2,100kb).
With these statistics in mind, SEOs have put considerable effort into increasing web performance to provide a better user experience which will indirectly help rankings. Thanks to the availability of tools like Page Speed Insights, Pingdom, GTMetrix, and Web Page Test, this has long been a focus even before its entry into the core algorithm.
Incoming Core Web Vitals
With the growth of the web as a whole, mobile-first indexing, and a stronger focus on UX, it’s been inevitable that web performance would play a larger role in rankings moving forward. This is where Core Web Vitals come in.
What are the Core Web Vitals?
They consist of three metrics which are all unique from each other:
Largest Contentful Paint (LCP)
This measures loading performance and is focused on the largest element that loads in on the initial viewport. It’s important to note this is different from first contentful paint, as that metric focuses on the first thing that’s loaded rather than the biggest.
Example
Using the Impression website as an example, we can see the element used to score the LCP on mobile. These are screenshots of the load on an iPhone X:

- The first screenshot shows the page without any stylesheets but with the logo loaded in, interestingly enough this is where the FCP would be scored as the logo is classed as contentful.
- The second image shows the main banner loaded in with the styling applied although the page is still missing some elements.
- The final piece to be loaded in is client logos.
Looking at these three screenshots the LCP would be scored by the banner image being loaded in as it’s by far the largest element on the page.
First Input Delay (FID)
First input delay measures interactivity. It’s focused on the time between when a user first interacts with a page (click a button or tap a link) and when the browser is able to start processing that interaction.
Cumulative Layout Shift (CLS)
This measures page stability. It’s an algorithm that looks at unexpected layout shifts when a page is loaded. This means that if you’re loading in banners very late in a page’s load time, the unexpected layout shift would harm your CLS score.
Example
Looking at a URL which has a poor CLS score (2.1) we can see what’s causing the shift: https://www.lequipe.fr/Football/
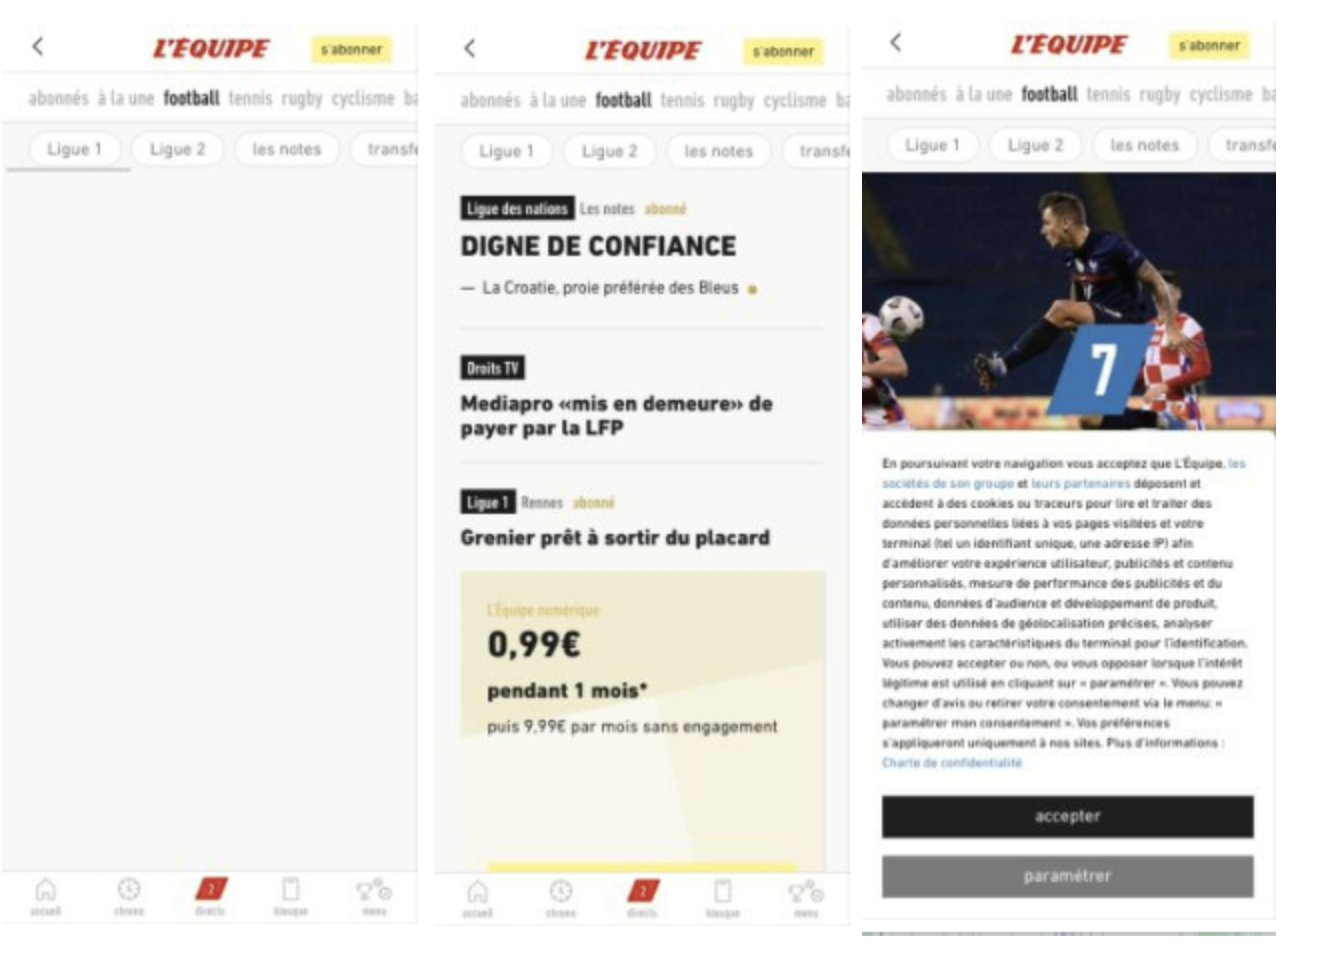
- The initial shell of the website loads in with the navigation and background.
- The page then loads in a list of news stories and advertisements.
- The page then loads in a huge banner along with its cookie policy.
The poor CLS score is generated from a list of URLs being visible to a user in the second image and then being completely overtaken by a banner moving everything around in the layout. This could cause the user to click on the wrong link and is exactly what the CLS score is trying to prevent.
How to measure Core Web Vitals
There is a wide variety of ways to measure your Core Web Vitals. Below are the main tools available to you.
Chrome User Experience Report
This is the most important way to measure your Core Web Vitals because it’s the actual data that you are being scored against. The Chrome User Experience Report is Google’s huge database of real user data passed back by Chrome.
This datasource is publicly available and can be queried through BigQuery to check your site’s scores. The best place to review this data at a domain level is through Google’s own Data Studio report which can be accessed here:
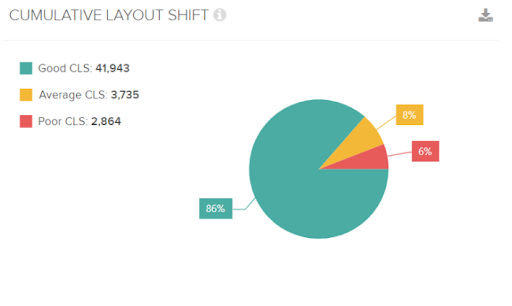
Once you’ve entered your domain, you’re taken to a detailed Google Data Studio report which shows you the three main Core Web Vitals metrics across your users’ devices.
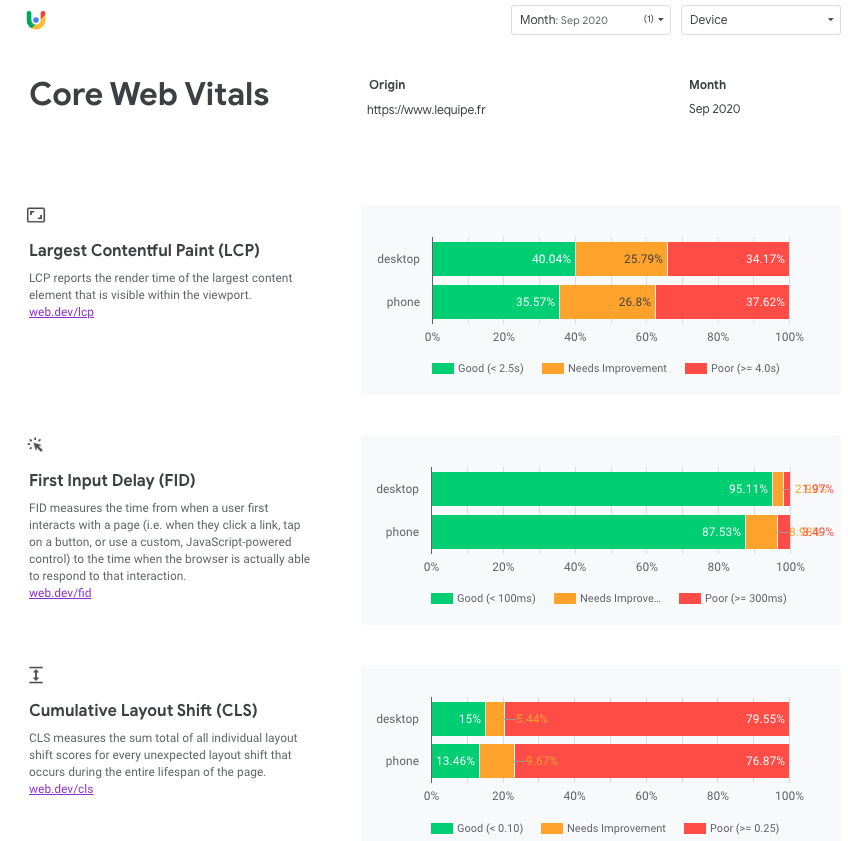
This is then split by Good, Needs Improvement, and Poor across your user base. When looking at these metrics there are a few things which need to be taken into consideration:
- These are scores for the WHOLE domain, not just the homepage. This means if you have a single very slow template, your overall scores may be impacted.
- As this is real user data there will always be people who have ‘poor’ experiences. Your site could be as fast as possible but a user could be on a very slow 3G connection on an ancient device.
- By being able to change it month by month you can provide insight on any improvements made over time.
Google Search Console
Google recently updated the performance tab in Google Search Console to use the Core Web Vitals. This can be accessed underneath the ‘Enhancements’ tab of any profile you’re verified on.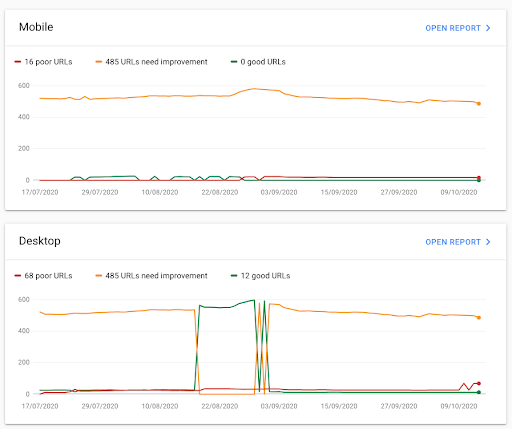
This splits between mobile and desktop and groups together URLs that have issues. It’s a great place to get top-level insight but we wouldn’t recommend it for auditing.
Page Speed Insights
The OG of all speed testing tools allows you to test each URL to provide granular Core Web Vital scores. It’s split into two different types of data:
- Field data – This is real-world user data from the Chrome User Experience Report and is the most useful data in the report. It’s worth mentioning that URLs won’t have this available if they don’t reach the threshold to be included.
- Lab data – This is lab data that is scored using a simulated device and can often be quite different from the field data.
Here is an example for one of Autotrader’s most popular pages: https://www.autotrader.co.uk/cars/bmw/3-series
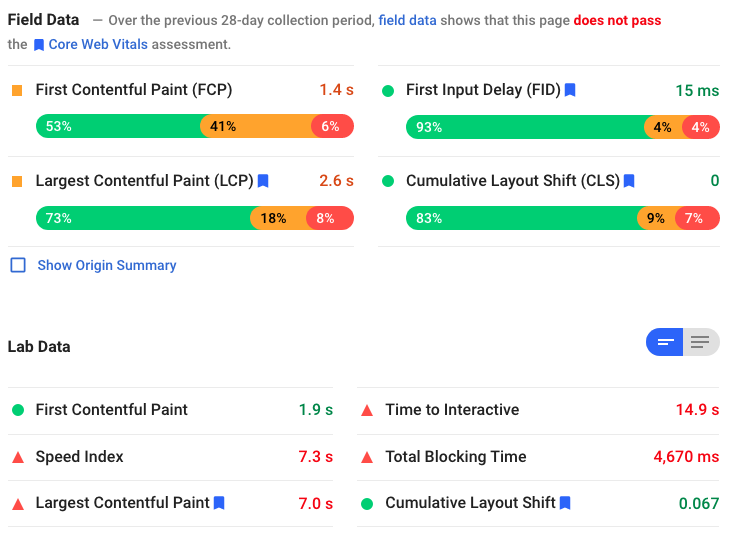
This example illustrates the difference between field data and lab data. If we look at the field data for LCP we can see it scores just under the threshold for ‘good’. Looking at the Lab Data for LCP it comes in at 7 seconds. This is because the device simulated with Page Speed Insights is a MotoG4 on a slow 4G connection. It’s clear that very few of the users on Autotrader are using this combination.
While Page Speed Insights is a powerful tool you need to understand the scores you’re working with. Be careful making recommendations from Lab Data as you could be trying to solve problems that don’t even exist.
DeepCrawl
DeepCrawl now allows you to capture Core Web Vital metrics during your crawl. This lab data helps you measure the scores at scale and can be found when you turn on JavaScript rendering. This saves a huge amount of time compared to individually testing each page using other tools.
This data won’t match up with your Page Speed Insights scores as they are using a different environment to test with. It’s also important to note that this doesn’t contain FID data as this can only be generated by real-time users.
Combining this data along with the real-world Chrome User Experience data will give you the most comprehensive Core Web Vitals scores to work from. After making any changes you can rerun the crawl and judge every single page across the site.
Find out more about DeepCrawl’s Core Web Vitals capabilities
How can we improve Core Web Vitals as an SEO?
With 2021 fast approaching and the Core Web Vitals becoming part of our workflow we need to work out how we as technical SEOs can look to improve our performance scores.
It’s not good enough to just send the developer a list of metrics and say ‘make these better’. Doing so provides very little context and can cause friction between developers and search marketers.
Instead, we can look to provide more detailed insights outside of these scores to show that we actually understand the recommendations we’re making.
Find the element which is being measured as the LCP
If a site is suffering from poor LCP issues, a great way to get further buy-in is by gathering the list of elements on a per template basis of what’s being judged as LCP.
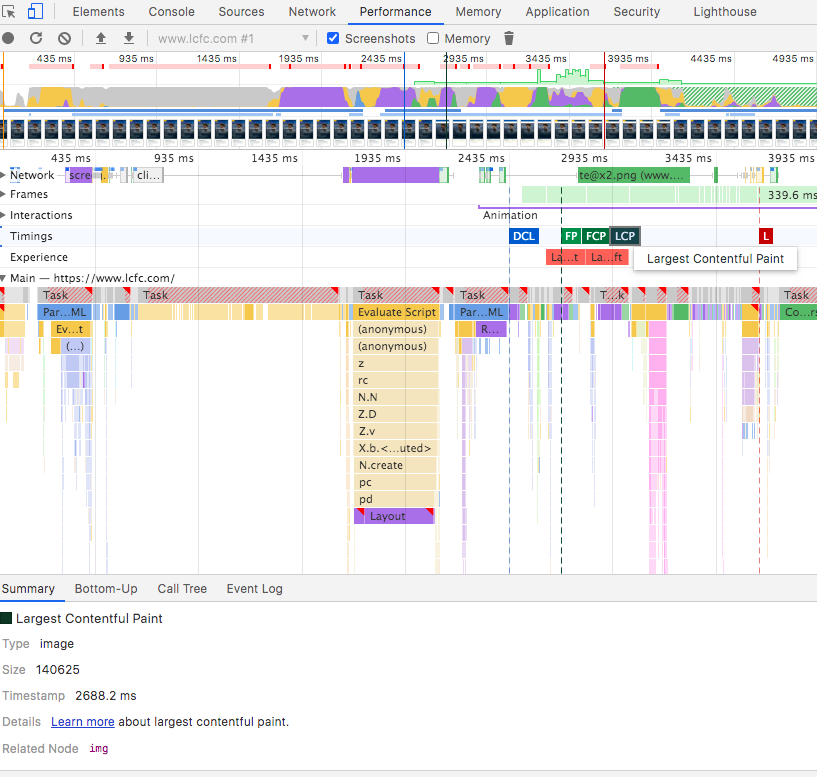
This can be done through Chrome Web Dev Tools:
- Open up your webpage and load in Chrome Web Developer Tools
- Click on the ‘Performance’ tabs and make sure ‘Screenshots’ is checked’
- Click the ‘Start profiling and reload page’
- Find the LCP on the timing graph
- Click on the node which it’s using; this is the element which is the LCP.
Below is an example of this:

By being able to provide this example to the development team per template you will find them much more receptive as the advice can change from:
Can you please fix the LCP?
To:
We’ve noticed that the product image is being bought in very late on in the page load, could we put this in as early as possible? This will help us achieve a higher LCP.
Benchmark your competitors
Some of the changes that will be recommended off the back of trying to improve your Core Web Vitals might end up taking significant development resources. This can often lead to pushback and can make it difficult to get the necessary work booked in.
A great way to frame this conversation is by benchmarking your site using the Chrome UX Dashboard (https://g.co/chromeuxdash) and doing the same for competitors. As this information is all publicly available it’s much easier to get buy-in by showing your competitors metrics.
This changes the conversation from:
We need to improve our CLS by changing our script load order.
To:
All of our SERP competitors are beating our CLS metrics, we’d like to suggest changing the way we load JavaScript in. This will help us either beat or match their scores.
Key takeaways
As the date these metrics are being rolled in is getting ever closer we will be hearing more and more about them. Some of the key takeaways from this article are:
- We as SEOs need to become familiar with these metrics, as we’ll soon be having to deal with them more and more
- Create a free Google Data Studio dashboard now! This data is very powerful and is free to review. Share this with key stakeholders to give them a top-level view.
- When recommending changes related to Core Web Vitals, provide as much detail as possible. It’s not good enough just sending over default recommendations from Page Speed Insights.
- Page speed won’t be the silver bullet to higher rankings if your content is poor.
- Use a wide variety of data sources to measure your Core Web Vitals, a combination of lab data (DeepCrawl and/or Page Speed Insights), and Chrome User Experience Report data is the best way to go.