

Brighton SEO 2020 Recap – Part 3
While no virtual conference can substitute for IRL BrightonSEO, being able to watch any of the talks (no having to choose favorite tracks!) and then rewatch some for further clarification has helped make up for some of my disappointment.
Three technical SEO talks that I’m glad to have the ability to go back and reference are those by Faisal Anderson, Hamlet Batista, and Niki Moiser.
If you, like me, want to rewatch the talks, you can still get a ticket to watch the replays. Otherwise, Chris Johnson collected many of the decks on seoslides.
Spying on Google: Using Log File Analysis to Reveal Invaluable SEO Insights
Faisal Anderson – Senior Technical SEO, LiveArea
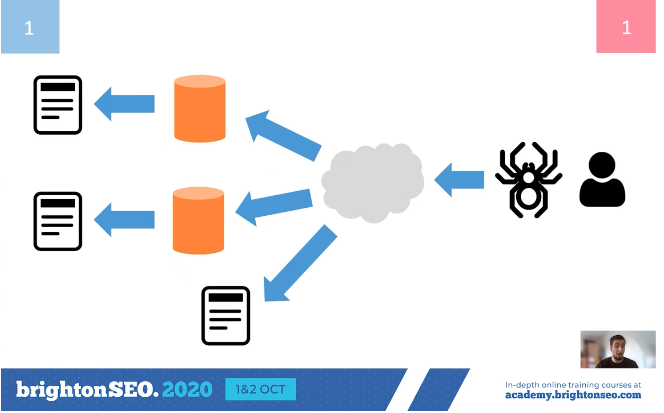
In this presentation, Faisal Anderson outlines his process for Log File Analysis – aka, “How to Spy on Google.”
Why You Need Log File Analysis
Faisal begins by outlining the reasons that log file analysis is superior to other methods of snooping on how Google is crawling your site. Why aren’t Google Search Console and web crawlers enough data?
Why Google Search Console Data Isn’t Enough
There are plenty of reasons that analysts shouldn’t rely on Google Search Console data for information about how Google is crawling their website.
First, data accuracy isn’t guaranteed – a lot of data in GSC is sampled, meaning that you don’t have the full details on how Google is crawling your website.
Additionally, you can only pull 1000 rows of performance data at a time, meaning that you’re very limited when working with larger websites.
Finally, Google owns the data in Google Search Console, and they don’t have the best track record with data accuracy and have been accused of having some bias in data.
My Web Crawler Can Crawl Like Google Right?
Web crawlers like DeepCrawl and Screaming Frog both have the ability to crawl like Googlebot.
Though web crawlers are helpful and are actually necessary to some degree for log file analysis, they don’t crawl exactly like Googlebot. Only log files will allow you to see exactly what Google is requesting from your website.
Log File Analysis
Now that he has covered the reasons you should use log file analysis instead of relying on other tools, Faisal jumps into his process of log file analysis.
Data Preparation
To do log file analysis, you will need log files from the website. Getting the log files is typically the hardest part of the entire process. To help get the data, Faisal sends an email to his client with some questions:
1. What is the hosting setup?
This is important because, depending on the configuration of the website’s hosting, the logs may be stored in different places. In cases where a CDN is used, accessing all the log files can be even more complicated. Understanding the setup is essential to ensuring you have all of the log files.
2. Is the hostname in the data?
Many log file setups are not configured to include the hostname. Because the hostname includes things like the subdomain and protocol, it is essential for log files analysis. If the hostname is not part of the current setup, it should be added so that log file analysis can be completed in the future.
3. Do you have 6 months of data?
Faisal likes to have around 6 months of log file data for analysis. More data gives you more facts!
Choosing the Best Tool
Now that you have your log files, you’ll need to choose the best tool for analyzing the log files. Faisal outlines a few options that he’s used.
Excel
Excel works for very small datasets but isn’t really appropriate for most log file analysis. In most cases, Excel isn’t powerful enough to do log file analysis effectively.
Screaming Frog Log File Analyzer
Faisal really likes Screaming Frog Log File Analyzer for log file analysis. One great feature is the differentiation between different user agents – something that really comes in handy for sites that are interested in how search engines other than Google are crawling their website.
Though Screaming Frog Log File Analyzer is a great tool, it comes up short with custom reports. The only reports available are the ones built into the platform, so no customization is possible.
Python and Jupyter
The limitations of Excel and Screaming Frog Log File Analyzer led Faisal to use Python and a Juypter notebook for most log file analysis. This solution also happens to be free, which is always a plus!

Data Analysis
Now comes the fun part – data analysis! Faisal splits this into three steps:
1. Crawl Behavior
First, we’ll analyze crawl frequency of a website by depth and internal linking. To do this, you merge and convert the log files to a CSV file. Then pull the file into a Jupyter notebook and merge it with crawl data including crawl depth. Once all the data is gathered, you can visualize URLs and requests by click depth.
2. Crawl Budget Waste
It takes a lot of energy for Google to crawl your website – especially large eCommerce websites. Because each site only has a certain crawl budget, it’s important to make sure that Google is crawling important pages. You can analyze crawl frequency by subdirectory to identify areas of crawl waste.
3. Site Health
Log file analysis can also alert you to issues in site health.
Faisal shares an example where a website that was being crawled with the Googlebot smartphone crawler reverted to being crawled with the Google desktop crawler after a site migration.
The website used dynamic serving to determine if the mobile code base or desktop case base should be used based on the device requesting the resource.
To identify what caused the reversion in crawling, Faisal used log files to find URLs with inconsistent http status codes over time. He then found which subfolders were “bugging out” most often so that the client could identify and solve the issue with the mobile site.
Faisal ended his talk by encouraging listeners to download his python scripts at Bit.ly/log-file-python (link currently not working)
Automating Google Lighthouse
Hamlet Batista, CEO, and founder of RankSense
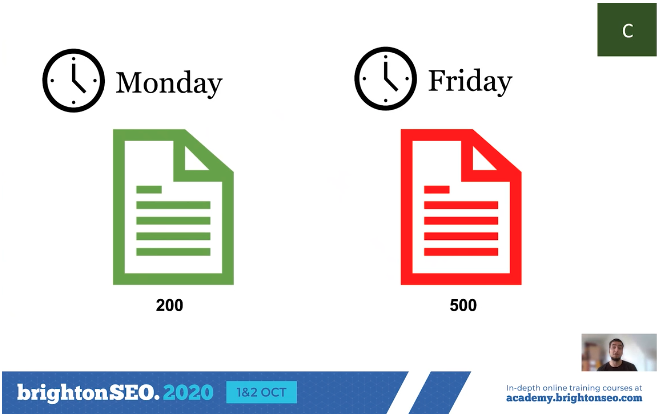
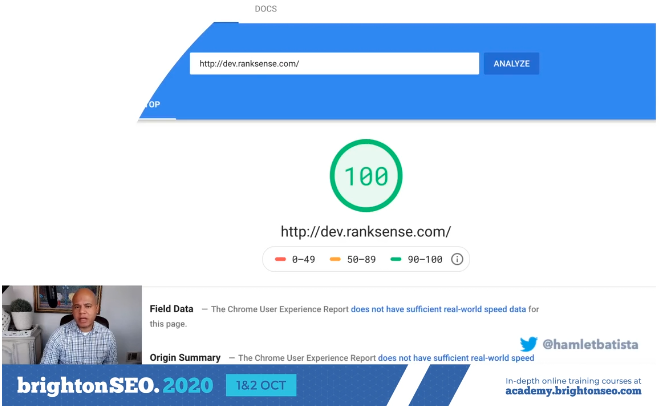
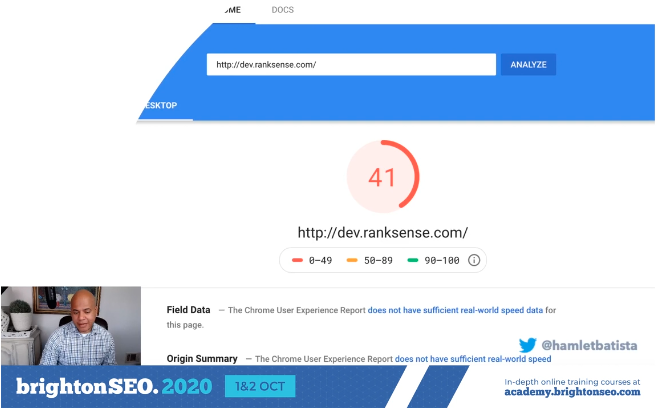
Hamlet opens with an all-too-common scenario for SEOs. You’ve worked with a client to get Pagespeed Insights scores up to good ranges and feel great about progress. Then, when you check in on those scores again the next day, they’ve dropped significantly because of a website update.
Because performance optimization is not one and done, you can set up an automated system to check for performance before deploying any updates to the website.
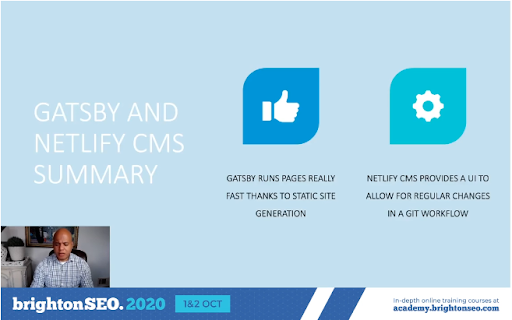
Automating Lighthouse Reports on a Gatsby Website
Hamlet has automated lighthouse performance checks on a Gatsby website and runs us through the process so that we can too.
Step 1: Download Gatsby
To begin, you should download Node.js and install Gatsby. Gatsby serves as your hosting provider and serves pages quickly thanks to static site generation.
Step 2: Install Netlify
Once Gatsby is installed, you’ll want to install Netlify, which will serve as your CMS to make changes to the website. Hamlet builds a site from a downloadable template.
Step 3: Set up a GitHub Repository
Next, you’ll need to set up a GitHub repository for your new Gatsby website. Once you have a Github user, you can connect Netlify to GitHub, save your files in GitHub, and deploy your website.
Step 4: Add Github Action to Run Lighthouse Reports When Changes are Published
GitHub allows you to set up continuous integration by checking your site against tests for issues before deployment. One of those tests that Hamlet sets up is a Lighthouse report.
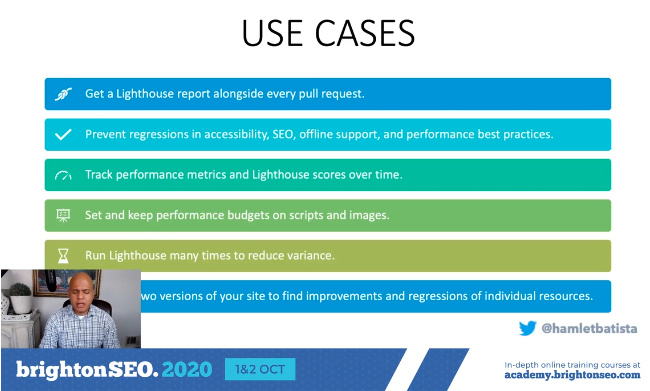
You can use Lighthouse CI Action, which runs on-demand, generates reports, prevents regressions, tracks performance, and will let you set up performance budgets.
Once installed, you can set up a workflow that runs Lighthouse with a set of test URLs.
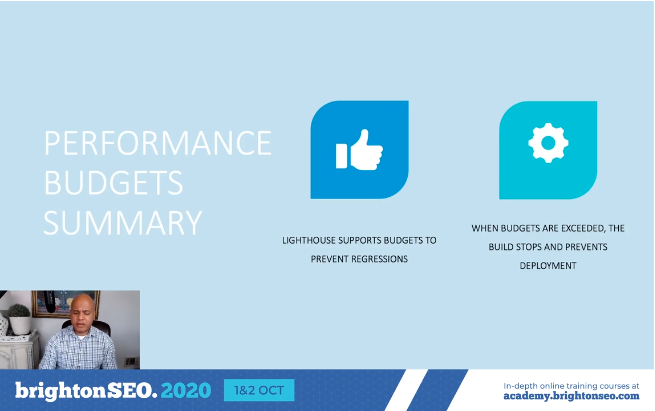
Step 5: Set Up Performance Budgets to Halt Deployment to Production
Hamlet outlines the settings necessary to actually set up a performance budget as part of your deployment workflow. If the pagespeed drops below these thresholds, production is halted. This ensures that the website updates do not negatively affect performance.
Step 6: Set up Performance Reports
Lighthouse CI already has some built-in reporting capabilities, where it captures every run and reports the change over time.
This is helpful for situations where the pagespeed is slowly dropping, but not actually halting deployment.
If you want more intense reporting capabilities, you can use PostGres to send the Lighthouse data to BigQuery, which connects to a variety of data visualization tools like Google Data Studio.
Hamlet runs through the process quickly and calmly, but the process is pretty technical! The slides have helpful information directly on them, but he’s also promised a detailed write up of the process soon.
Competitor Analysis – From a Technical Perspective
Niki Mosier, Head of SEO, Two Octobers
Niki outlines why and how to do a technical SEO competitor analysis for clients.
Why do a Technical Competitor Analysis?
Niki recommends a technical competitor analysis for clients in three circumstances:
To overcome implementation struggles
Sometimes you make recommendations to a client but have trouble getting buy-in from stakeholders for implementation. One technique that can work to gain buy-in is to show clients how they stack up against their competitors.
To Determine Why There has Been a Drop in Traffic or Rankings
If a client has recently experienced a drop in traffic or rankings, a technical competitor analysis may help expose areas where competitors are ahead.
To Provide Additional Value to Clients
Even when there isn’t an urgent need for a technical competitor analysis, it can provide a lot of value to clients to know how they stack up against their competitors.
How to do a Technical Competitor Analysis
Nike breaks down a technical competitor analysis into three steps: Identifying Competitors, Gathering Data, and Looking for Opportunities.
Identifying Competitors
Niki recommends identifying 3-5 competitors for technical analysis. Any more and the data gets difficult to sort through and find opportunities.
You should also look for competitors who are performing well on mobile and desktop devices separately, since the competitors on each may be different. You should also identify competitors with a variety of search volume potential.
Variety in search performance is important when selecting competitors to analyze.
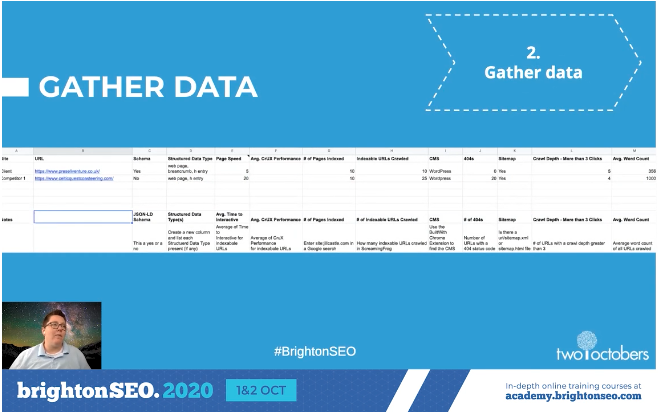
Gathering Data
What type of data should you gather? Crawl data is a useful starting point – Niki reminds people to crawl competitor sites kindly as not to overwhelm their servers. SEMRush and Ahrefs data are useful for gathering keyword and backlink data. She also recommends gathering Core Web Vitals performance metrics.
Looking for Opportunities
Once the data is gathered, it’s time to analyze it.
Niki uses a report card style Google Sheet template to visualize the technical performance of competitors. She’s been kind enough to share that template!
Some recommended areas to check for opportunities are page speed, indexation, structure data, and CMS.
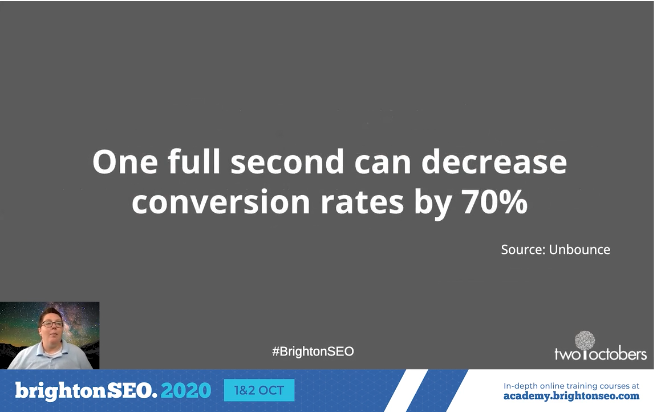
Page Speed
With the rollout of Core Web Vitals, many people are checking user experience metrics, but mobile load time is also a very important conversion metric. One second slower performance has been shown to decrease conversion rates by 70%!
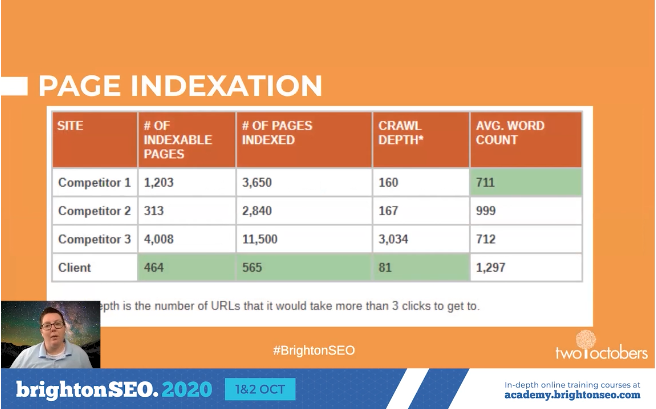
Page Indexation
Check for crawl errors, duplicate content, and crawl budget waste. URLs indexed vs the number of URLs that are indexable helps you identify crawl issues. Crawl depth helps you understand how many clicks from the homepage it takes to access pages. And word count helps you identify thin content.
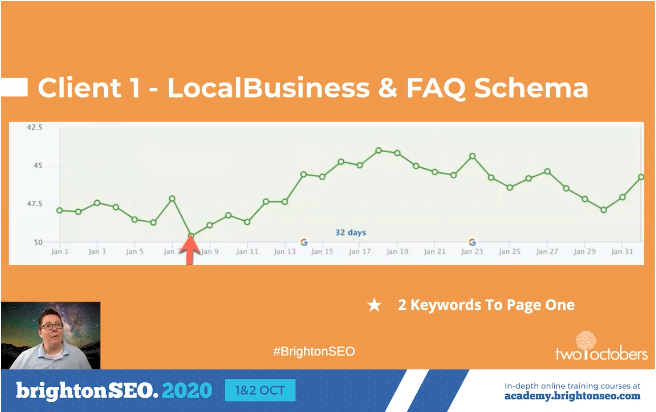
Structured Data
Questions to ask include: Which pages have structure data? What types of structured data are on the website? What format is the structured data? Are there validation errors with the structured data?
CMS
Niki also likes to see what CMS competitors are using in comparison to the client, as this sometimes exposes infrastructure issues that aren’t immediately apparent.
Niki then runs us through some real-life examples of wins her clients have experienced after implementing findings from a competitor analysis.
Recap
Once you’ve collected and analyzed the data, it’s time to present it to the client.
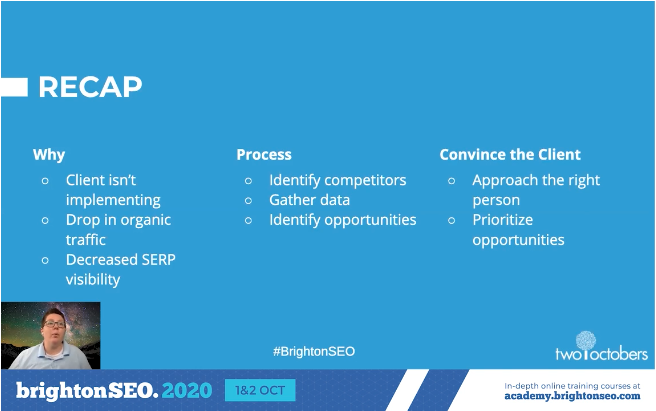
If you’re going to convince the client to take action, you have to find the correct stakeholder at the organization who can implement change.
Since you’ll likely find a wealth of opportunities when completing the technical audit, prioritize them to help make that process easier for your client. Niki’s report card is a nice way to visualize and prioritize the data so that clients are able to take action!