
We’ve written many times about the about the benefits of using Google Looker (formerly Data Studio) for SEO. Since launch, it has become the defacto dashboarding and analysis solution in the industry. In the past, you would have had to use workarounds to get Lumar data flowing into Looker, but with our official connector the process is seamless.
Lumar’s Looker Studio connector allows you to access most of your Lumar data—including our new accessibility reports—directly in dashboards. All data is pulled in live, meaning that as new crawls are run or projects are added to your account, dashboards will automatically update. Dashboards can be shared with anyone in your organization even if they do not normally use Lumar.
Looker Studio Connector
This is an official Google Partner connector, meaning that it can be found in the main Looker Studio connectors list. However, if you are planning to use any of our free templates, it is recommended that you use the links directly from this page or elsewhere on our website (as these are pre-configured with appropriate settings).
By default, the connector comes with a report template that is suitable for “Crawl” data. Get more Looker Studio templates in our dedicated template guide.
Lumar’s Looker Studio Connector
Important: All of our example templates require the “Allow ‘Crawl Selection’ to be modified in reports” checkbox to be selected. Omitting this will prevent the template from working correctly.
Getting started
Open the connector using the links above, or find it by searching “Lumar” (our previous name – we’re working on getting it updated) inside Looker Studio. If you don’t see your accounts inside the connector, please contact your CSM or support. Looker Studio is not enabled for “Light” or “Starter” accounts at this stage.
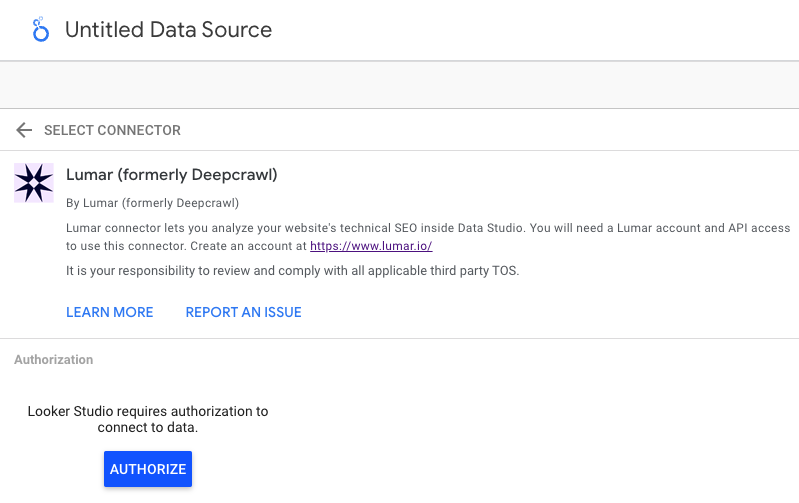
Authenticate
When you first use the connector with a Google account, you’ll need to go through two authentication phases.
The first authorization is to allow our connector to utilize your Google account. This gives permission for our connector to contact our API to retrieve the data required for dashboards.
The second authentication step asks for your Lumar API key. You can generate a new API key in your Lumar account. When entering this into the connector, the format must by id:key – for instance, if your Lumar API ID is 2438 and the API Key is “abcdef123”, then you need to enter 2438:abcdef123. If you are unable to proceed, then the most likely reason is that this API key is entered incorrectly.
Note that in order to protect the security of your account and your data, API keys are not able to be revealed or recovered once they are generated and initially supplied upon generation. However, you are able to generate infinite API keys in the event that a previous one is lost or unrecoverable, up to a maximum of 2 active API keys at a time per account.
Each Google account can only be associated with one Lumar API key.
Setting up your first datasource
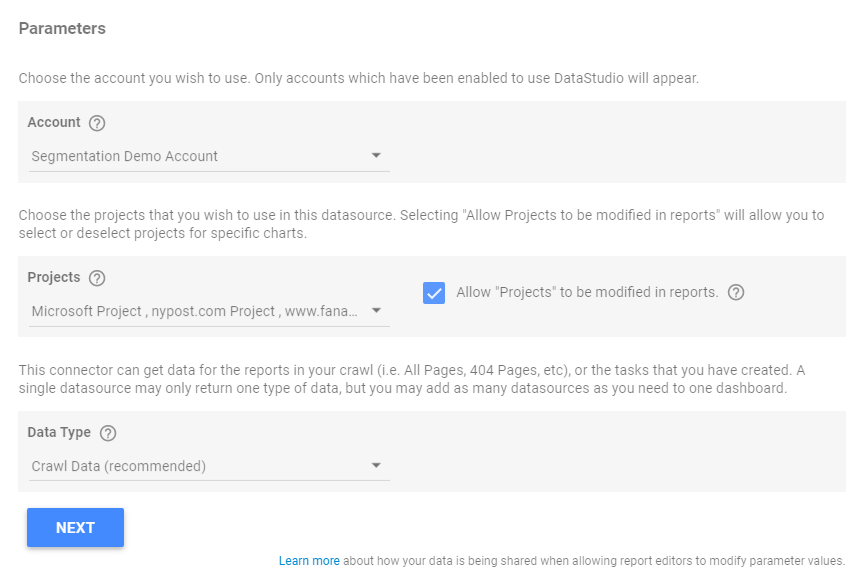
Account
When you first load the connector, an account will need to be selected. Many users will only have access to one account. If you do not see any accounts, or if the account names are not descriptive enough, please contact your CSM.
Projects
The connector can return data for a single project, or multiple projects in one dashboard. When getting started, it is easy to select just one project. We recommend selecting “Allow Projects to be modified in reports.“ as this means that you’ll be able to add or change projects for a single visualization within the dashboard
Data Type
There are three different ways to use the connector:
- Crawl Data gives you access to all reports in a crawl, their trends over time, and the number of URL/Links which appeared in each report. This mode is best for anyone who is just starting out with the connector, or who wants to get a specific data point or trend line. This mode is compatible with Lumar’s upcoming Segmentation feature.
- Issues will return a list of issues that we found in a crawl. You are unable to easily choose the specific reports that you want to see, but this data is great for when you just want to list (for instance) the top 5 problems in a crawl, without knowing what those problems are in advance. This mode is compatible with Lumar’s upcoming Segmentation feature.
- Tasks will return all of the tasks that exist in your projects. This is perfect for zoning in on specific issues, creating custom charts (as tasks can be granularly filtered to areas of your website), and comparing the same issue across multiple websites.
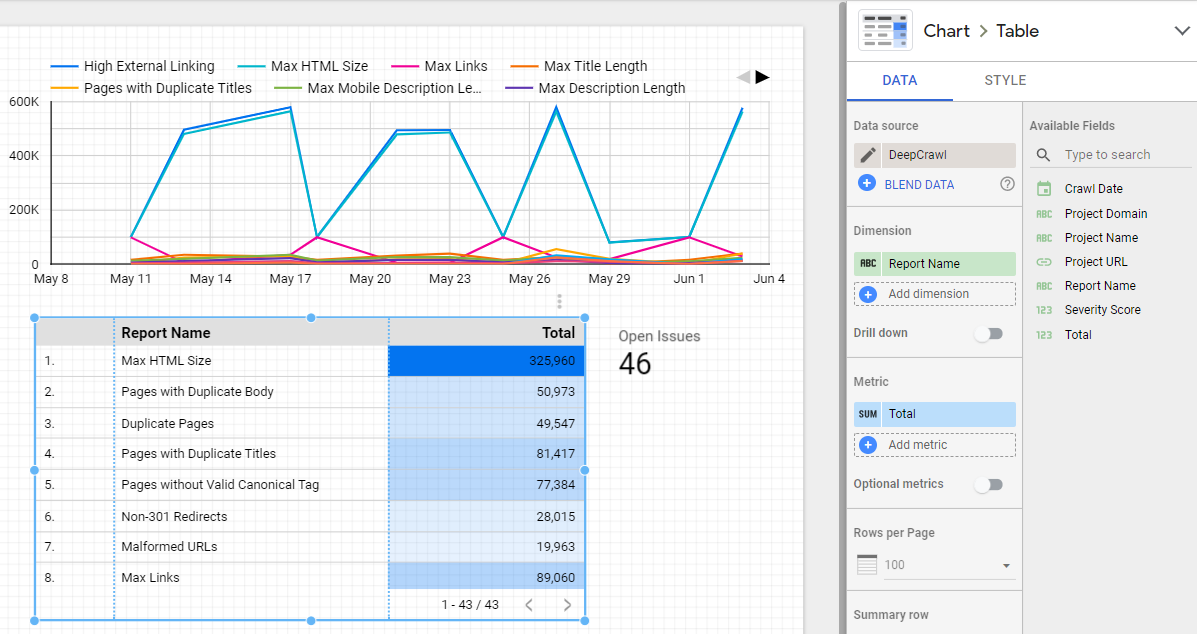
“Crawl Data” data type
After choosing the “Crawl Data” mode, you will be presented with three further options:
Crawl Selection
The connector allows you to pull in data for with the most recent crawl (for creating individual datapoints), or several crawls over a date range (for time-series charts). If this is your first dashboard, choose “Latest Crawl”. To allow you to switch between “Date Range” and “Latest Crawl” within a dashboard, it is essential that the “Allow ‘Crawl Selection’ to be modified in reports.“ option is turned on.
Segmentation
If your account and projects use segmentation, you can allow Looker Studio to retrieve data for your segments. When activating segments, you’ll have the option to “Use Segments” or “Use Segments with All URLs Segment”. These will make all segments available, and the latter will create additional “All” segment which has the default (unsegmented) Lumar data. This is important as your crawls may not necessarily cover all URLs in a crawl, however means that you will need to filter this All segment out from all segment breakdown charts.
If this is your first dashboard and for any chart that is not explicitly using segmentation, we recommend that you leave “Use Segments” turned off.
“Roll Crawls Up”
When pulling data from multiple projects into a table that is pivoted by date, it is unlikely that all crawls will happen to line up on the same date, making data analysis harder. The “Roll Crawls Up” changes crawl dates so that they are all reported on the same date. If you select “Weekly”, all crawls that occurred in a given week will be reported to have happened on a single day of that week. If you select “Monthly”, all crawls that occured during that month will be reported to happen on the first of the month.
After all configuration is done, you can select “CONNECT” then “CREATE REPORT”
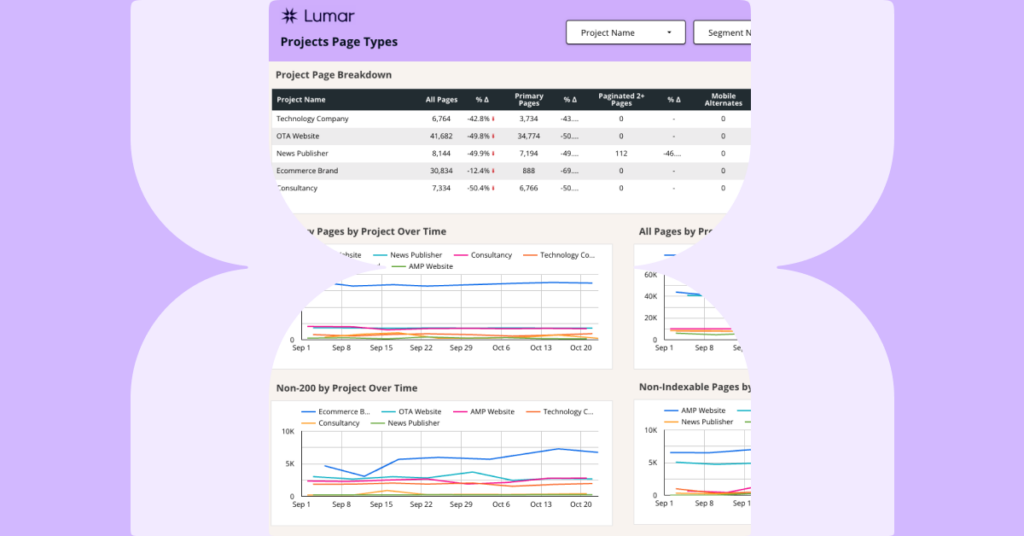
Example
This mode gives you access to quickly create custom charts based on specific reports:
“Issues” data type
The Issues data allows you to recreate and expand Lumar’s “Issues” insights by returning an ordered list of the biggest issues impacting the crawl. When selecting this mode, the same configuration options as “Crawl Data” are displayed:
Crawl Selection
The connector allows you to pull in data for with the most recent crawl (for creating individual datapoints), or several crawls over a date range (for time-series charts). If this is your first dashboard, choose “Latest Crawl”. To allow you to switch between “Date Range” and “Latest Crawl” within a dashboard, it is essential that the “Allow ‘Crawl Selection’ to be modified in reports.“ option is turned on.
Segmentation
If your account and projects use segmentation, you can allow Looker Studio to retrieve data for your segments. When activating segments, you’ll have the option to “Use Segments” or “Use Segments with All URLs Segment”. These will make all segments available, and the latter will create additional “All” segment which has the default (unsegmented) Lumar data. This is important as your crawls may not necessarily cover all URLs in a crawl, however means that you will need to filter this All segment out from all segment breakdown charts.
If this is your first dashboard and for any chart that is not explicitly using segmentation, we recommend that you leave “Use Segments” turned off.
“Roll Crawls Up”
When pulling data from multiple projects into a table that is pivoted by date, it is unlikely that all crawls will happen to line up on the same date, making data analysis harder. The “Roll Crawls Up” changes crawl dates so that they are all reported on the same date. If you select “Weekly”, all crawls that occurred in a given week will be reported to have happened on a single day of that week. If you select “Monthly”, all crawls that occured during that month will be reported to happen on the first of the month.
After all configuration is done, you can select “CONNECT” then “CREATE REPORT”
Example
The issues data gives you access to the top problems we found in your crawl.
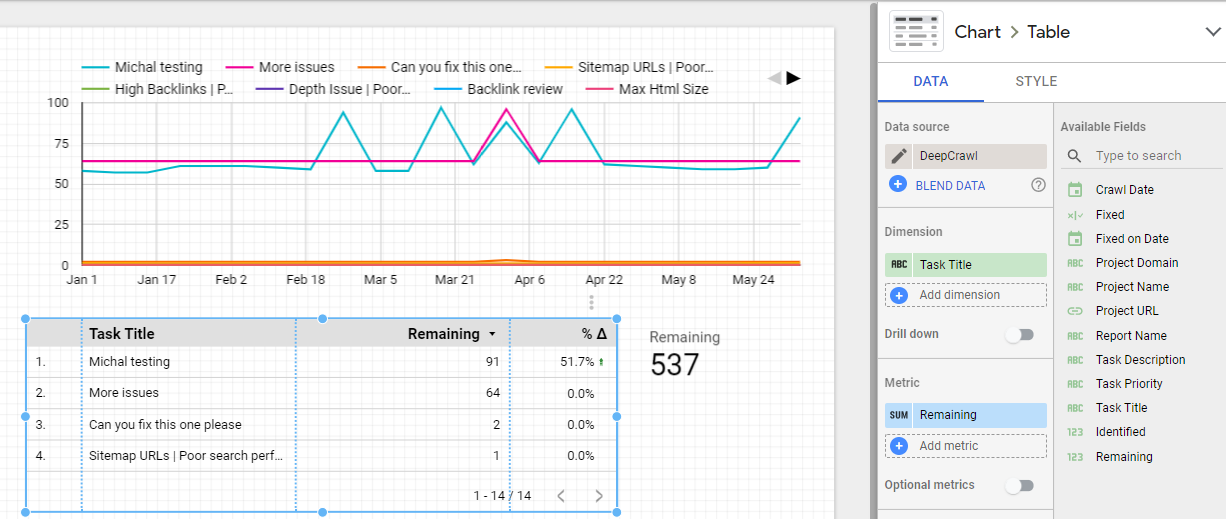
“Tasks” data type
The Tasks type gives you access to the Tasks that are set up in your account.
Crawls
The connector allows you to pull in data for with the most recent crawl (for creating individual datapoints), or several crawls over a date range (for time-series charts). If this is your first dashboard, choose “Latest Crawl”. Again, we recommending selecting “Allow ‘Crawls’ to be modified in reports.“ to give yourself flexibility later.
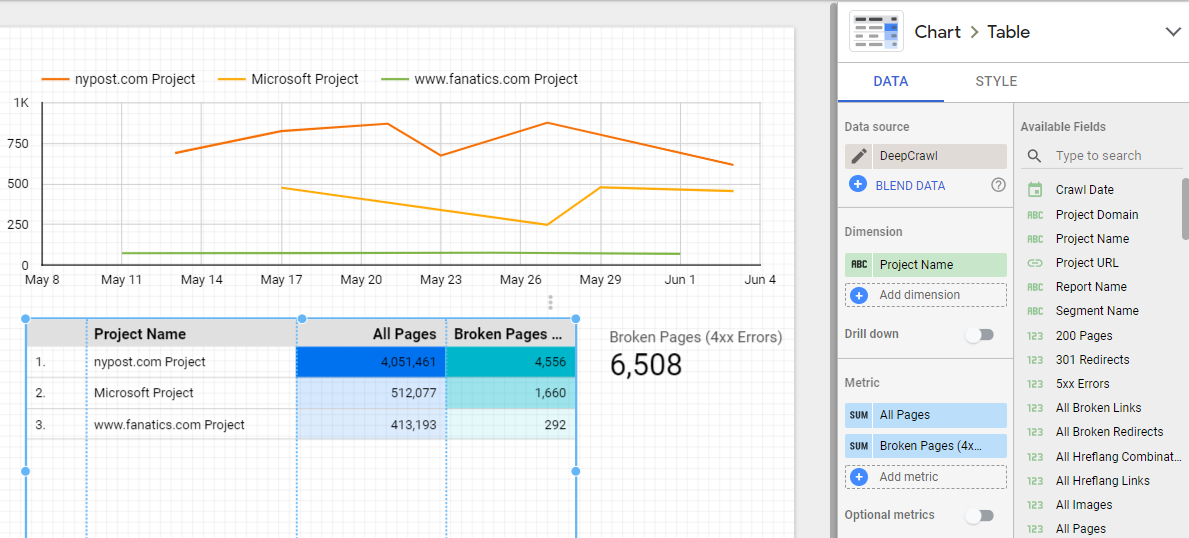
Example
Working with Date Ranges
Looker Studio is built to use continuous data (that is, data which constantly evolves), whereas Lumar generates data in discreet intervals (crawls which happen an a daily, weekly, or monthly basis. This can make working with date ranges in Looker Studio tricky – if you’re not careful, you can end up looking at numbers which are summed from several crawls. To help you navigate Looker Studio’s understanding of time, we have added a “Crawls” selector which allows will force the connector to either return data for a range of crawls (defined by your dashboards “Date” selection), or for the latest crawl only.
“Date Range” is intended to be used in any time-series chart that Looker Studio offers, or when you want to calculate aggregations of metrics, such as the average number of pages in your website.
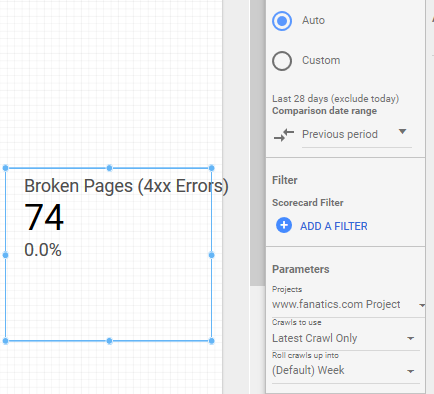
“Latest Crawl” will return information about the latest crawl for a given project (regardless of when it was), and should be used anywhere that you want to display a single number – tables, pivots, scorecards, etc.
Per-chart Crawl Selection Setting
Our connector is designed to allow you to choose whether you want to pull in either data from the latest crawl or from a date range on a chart-by-chart basis. For instance, you could have a time-series graph showing the evolution of your Broken Pages over time, and a score card showing the number of broken pages that currently exist. For this to work, the “Allow ‘Crawl Selection’ to be modified in reports” option of the connector configuration must be switched on. With this mode on, each chart will have a new configuration to allow you to switch the data type.
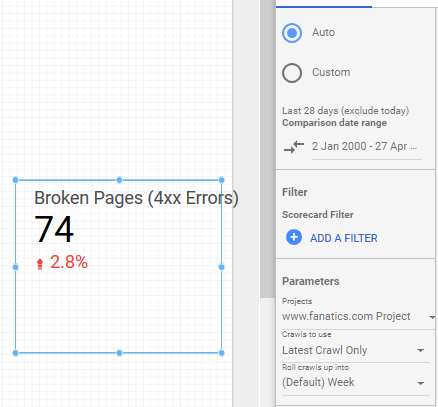
Compare to last crawl when viewing a data point from latest crawl
When viewing data from the last crawl, Looker Studio will always display data from that crawl (even if you’re viewing a comparison datapoint), meaning that “Comparisons” will always show no change.
Looker Studio is not designed to handle data in this way, so allow you to compare the latest crawl with the previous one, we have built in a cheat code: When using the connector in “Latest Crawl” mode, choosing the comparison date range to start on January 2nd, 2000 will make Looker Studio use the previous crawl.
The connector stops working or becomes disconnected
Google limits each user to a maximum number of requests to external services per day. This limit is 100,000 requests per day for GSuite accounts, and 20,000 requests per day for gmail.com accounts. The limit applies to all of the integrations that you have – any Looker Studio connector, most Google Sheets integrations, etc. For instance, if you connect Lumar, Google Analytics, and Salesforce to a Google Looker Studio dashboard using a gmail.com account, your quota is 20,000 requests across all of the integrations.
Once your request limit is consumed, all services will stop working and Looker Studio will give you an error message when you attempt to use a dashboard. The dashboards should start working as normal when your limits are reset (Google does this on a daily basis).
If you are experiencing this issue, we recommend that you:
- Do not create all dashboards and datasources with a single person’s Google account. Use more than one Google account to create your Looker Studio datasources.
- Ideally use one Google account per datasource if this will be used by many clients (as each person’s use of the dashboard will use some of the quota)
- Use a Google GSuite account instead of an @gmail.com account when creating the datasource
Getting raw URL information
This connector allows you to access our main report/insight information inside of Looker Studio – for instance, you can get the number of Broken Pages that we found in your crawl, but you are unable to get each URL that is broken, or the HTTP status code of those URLs. To access and analyse raw data (such as each URL and its HTTP status code), you can connect Looker Studio with data from our BigQuery connector – please contact your CSM for more information.


