
Lumar Monitor is designed to drastically cut time spent monitoring multiple domains or large, complex websites. It helps you easily detect changes and trends that impact site performance, and identify where to focus your attention. Custom alerts give you notifications on the issues that matter most to you, while saving time and keeping notifications relevant with automatic updates to new thresholds based on previous crawl data.
Introduction
What is Monitor?
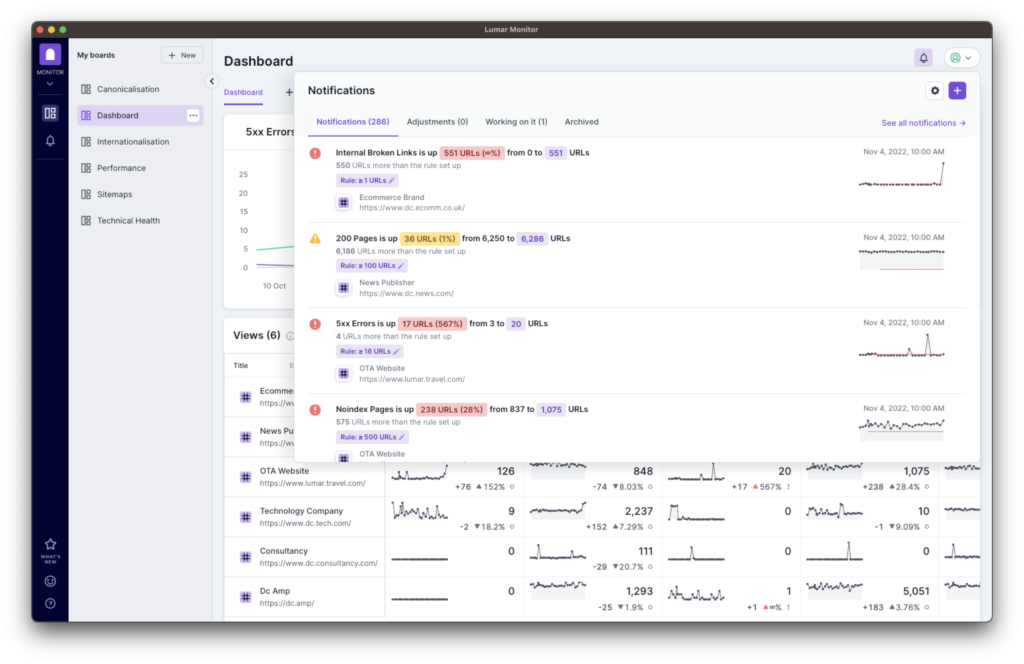
Monitor gives you a high-level view of all your domains, or sections of your site, in one place. A scannable table means you can quickly spot changes and trends that need attention, and customizable alerts will notify you in-app or via email, Slack or Microsoft Teams when a threshold has been breached.
Core benefits:
- Focus your attention and take swift action. Act quickly with custom alerts and a scannable overview of multiple domains or sections of your site in one place.
- Focus on the metrics that matter most. Avoid the noise with custom alerts that allow you to focus on the most relevant data.
- Spot trends and prove investment cases. Easily see when a metric is moving in the wrong direction, and provide evidence to secure investment.
- Save time spent manipulating data. Spot issues and trends from within Lumar. No need to download and manipulate data in spreadsheets.
Who is Monitor For?
Monitor brings benefits to a number of organizations, principally:
- Multi-domain brands. For organizations with multiple brands, it can be difficult to stay on top of the technical health of each brand site, and quickly identify issues or SEO trends. With a high-level overview of all sites in one place, technical SEOs and digital leaders can get a quick view of how their sites are performing, and quickly spot trends or issues that need addressing. Customized alerts also help ensure issues are quickly rectified.
- SEO Agencies. Just like multi-domain brands, agencies also need to stay on top of the technical health of multiple brands, but for their clients rather than their own organization. With Monitor, agencies can easily track their customers’ websites for spikes or trends, and receive alerts of technical health issues or trends that need addressing.
- Large Websites and International Brands. For businesses with very large and complex websites, staying on top of all site areas can be just as challenging as managing multiple brands. With Monitor, you can see an overview of all the important parts of your site in one place, such as different product or content categories, or different geographies, so you can spot trends or issues in particular areas of your site.
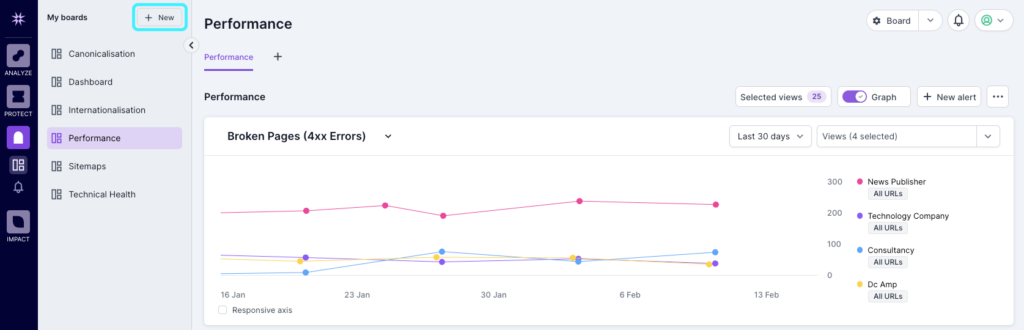
Creating Monitor Dashboards
Once you’ve logged into Lumar Monitor, click ‘New’ at the top left of your screen.
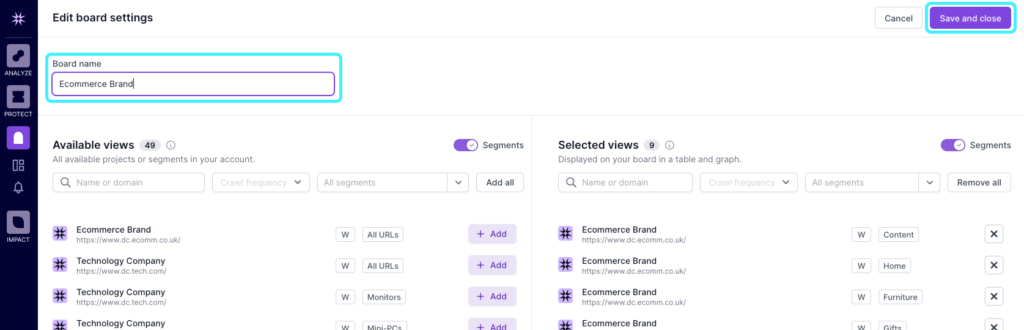
You’ll now see the ‘Create new board’ screen where you can give your new board a name. Underneath this you’ll see:
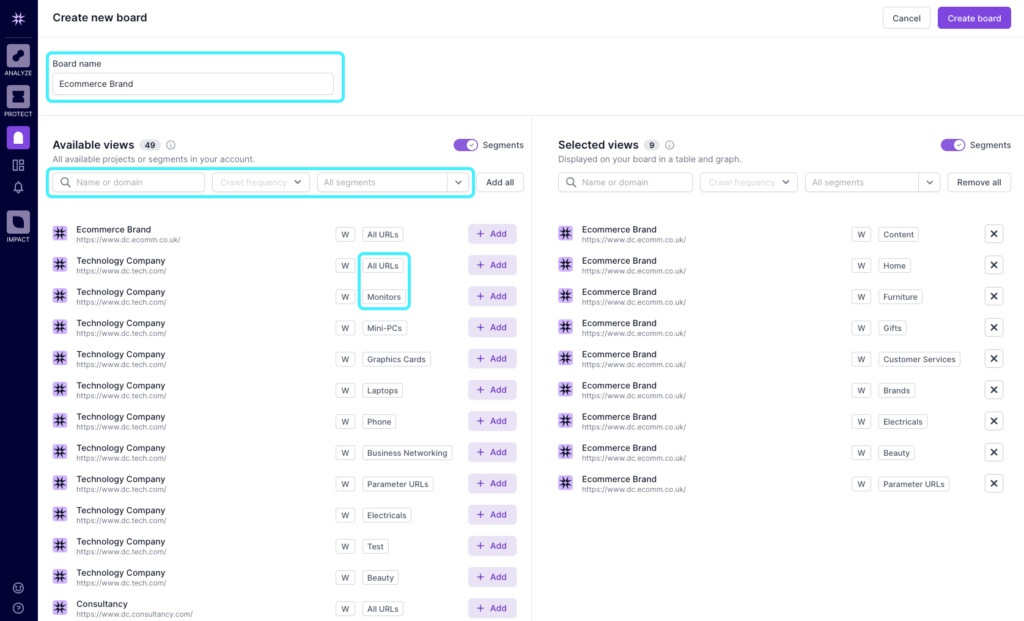
- Available views on the left hand side, which displays all of the views available across the whole account, filterable by project name or domain, segment name and crawl frequency. ‘All URLs’ indicates the entire project (i.e. no segment selected) whereas segment views will have the name of the segment indicated.
- Selected views on the right and side, which shows the specific views you have chosen to use in this board and any of its dashboards.
To select a view, simply click on the ‘Add’ button to move it from the available views list to the selected views list. By default, all views selected in the board settings will display on new dashboards, but you’ll be able to customize this later.
After you select your desired views, click on “Next” at the top right of your page.
You’ll then see an option to choose a template. These have pre-set metrics that you can use to get started and customize rather than building a dashboard from scratch, to help save you time and quickly get up and running with Monitor.
The templates available are as follows:
- Link Health – Overview of link health issues across groups of sites.
- Columns:
- Broken Pages (4xx Errors)
- 5xx Errors
- Broken JS/CSS
- Broken Sitemap Links
- Error Pages with Backlinks
- All Broken Redirects
- Top Graph:
- Broken Pages (4xx Errors)
- Columns:
- Redirects – Overview of redirect issues across a group of sites.
- Columns:
- All Redirects
- 301 Redirects
- Non-301s
- All Broken Redirects
- Redirect Loops
- Redirect Chains
- Top Graph:
- All Redirects
- Columns:
- Canonicals – Overview of canonical issues across a group of sites.
- Columns:
- Pages without Canonical
- Canonical to Non-200
- Canonicalized and No-indexed
- Conflicting Canonical Tags
- Rendered Canonical Mismatch
- Orphaned Canonical Pages
- Top Graph:
- Pages without Canonical
- Columns:
- Sitemap Hygiene – Overview of sitemap issues across a group of sites.
- Columns:
- Pages in Sitemaps
- Pages Not in Sitemaps
- Broken Sitemap Links
- Non-Indexable URLs in Sitemaps
- Disallowed/Malformed URLs in Sitemaps
- Broken/Disallowed Sitemaps
- Top Graph:
- XML Sitemaps
- Columns:
- Content – Overview of technical content issues across a group of sites.
- Columns:
- Missing H1 Tags
- Duplicate Pages
- Empty Pages
- Missing Titles
- Duplicate Titles
- Missing Description
- Short Description
- Pages with Duplicate Descriptions
- Pages with Duplicate Body
- Top Graph:
- Missing H1 Tags
- Columns:
- Performance – Overview of key metrics indicating speed and user experience (UX) across a group of sites.
- Columns:
- Poor Cumulative Layout Shift (CLS)
- Slow Time to First Byte (TTFB)
- Slow First Contentful Paint (FCP)
- Slow Largest Contentful Paint (LCP)
- Slow DOM Content Load (DCL)
- Slow Time to Interactive (TTI)
- Top Graph:
- Poor CLS
- Columns:
To select a particular template, just click into the box on the left of the template you want to use. The list of reports included in the template will then populate on the right side of the screen.
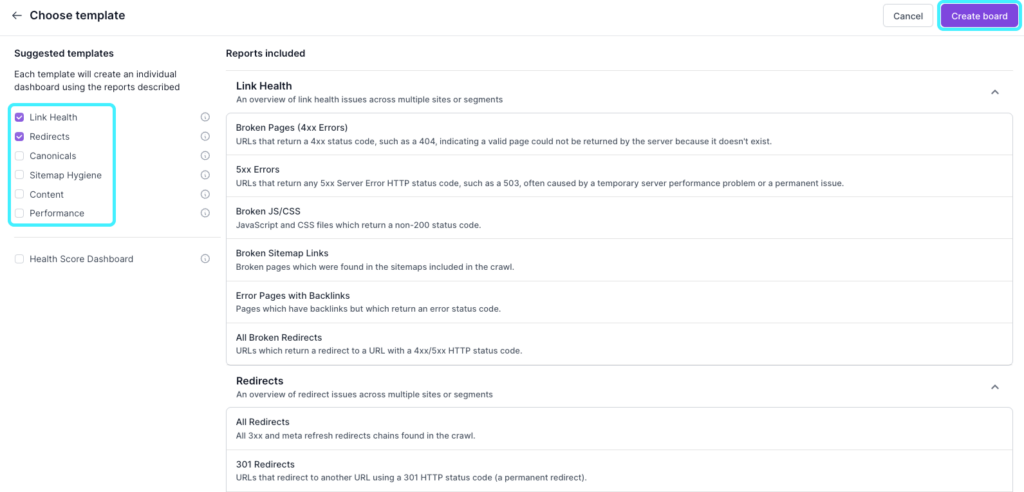
Once you have selected the templates you want to use, click ‘Create board’ in the top right hand corner of the screen.
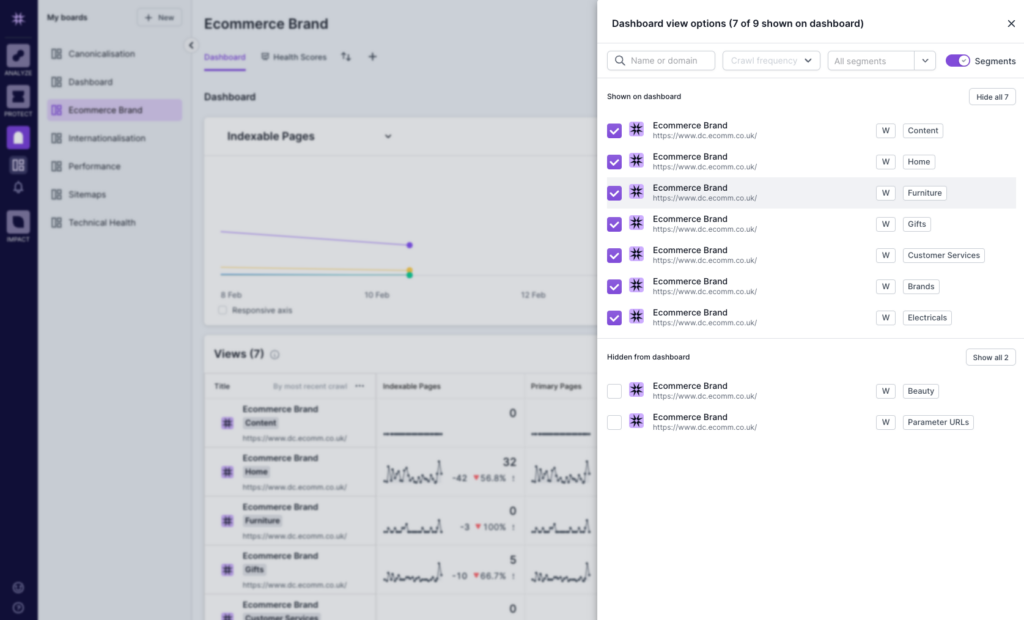
To customize each dashboard, the “selected views” options allow you to show or hide views from the list selected in the board settings. Once this has been set, you can then choose which of the views you’ll see in the top graph.
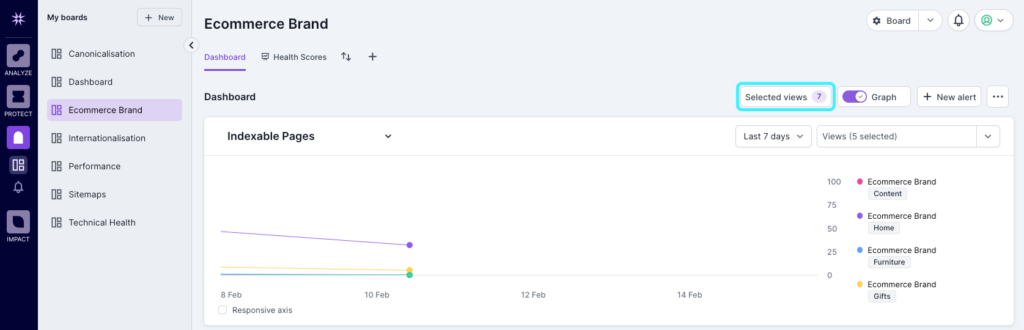
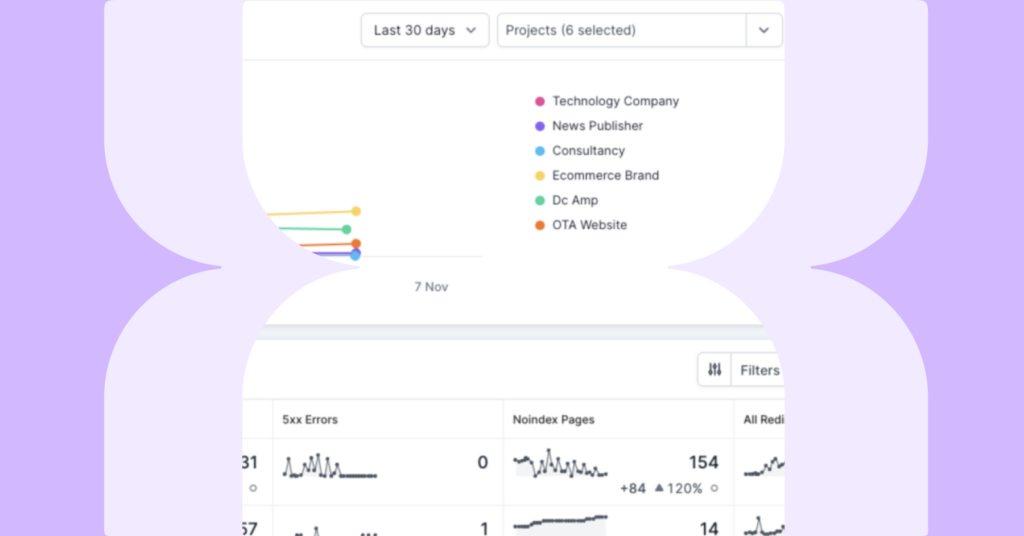
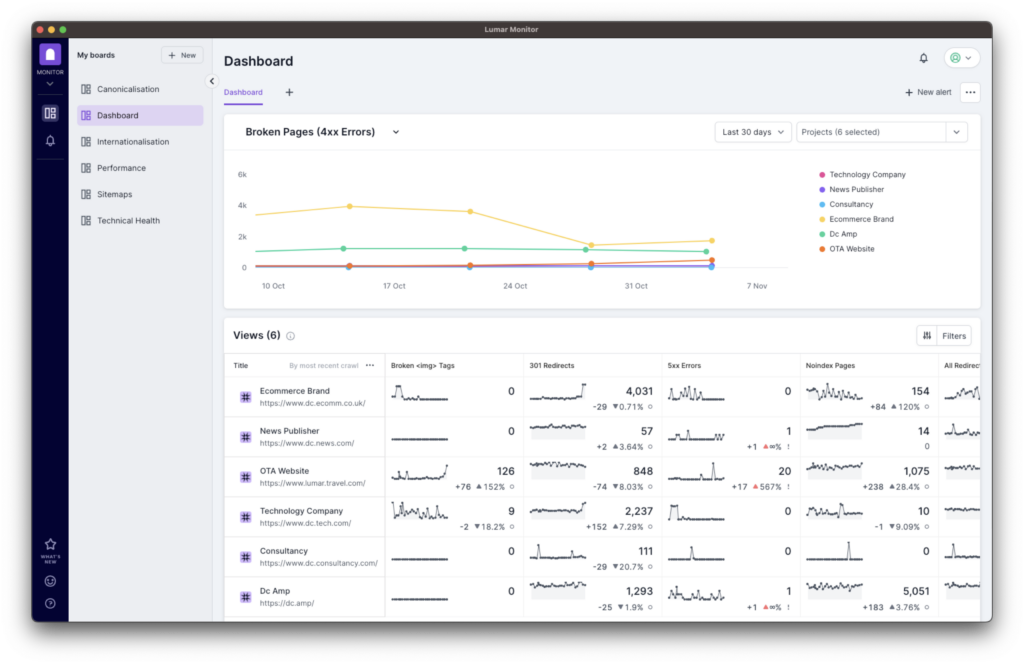
With each dashboard, you’ll see the trend lines for each metric and each project. As new scheduled crawls complete in the platform, the data will become available in Monitor. Within each cell, you’ll see the following information:
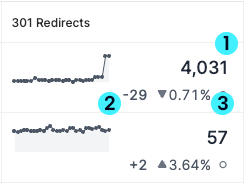
- The total number of pages in the last crawl for the relevant metric.
- The absolute change in the number of pages compared with the previous crawl.
- The % of difference in pages compared to the previous crawl.
Clicking on the relevant trend graph will take you to the corresponding report in Analyze.
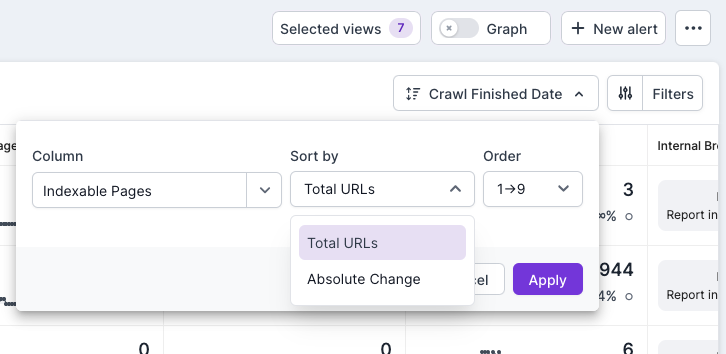
Sorting Views
To help you quickly identify the biggest issues or changes across your domains or site sections, you can sort the columns in the Monitor dashboard:
- Report columns can be sorted by Total URLs or Absolute Change.
- The View Details column can be sorted by Segment Name, Project Name or Crawl Finished Date.
By clicking onto the column actions (three dots) in the column header, you can choose what to sort by and the sort order. One sorted, you’ll also then see an indicator to show which column the table is sorted by.
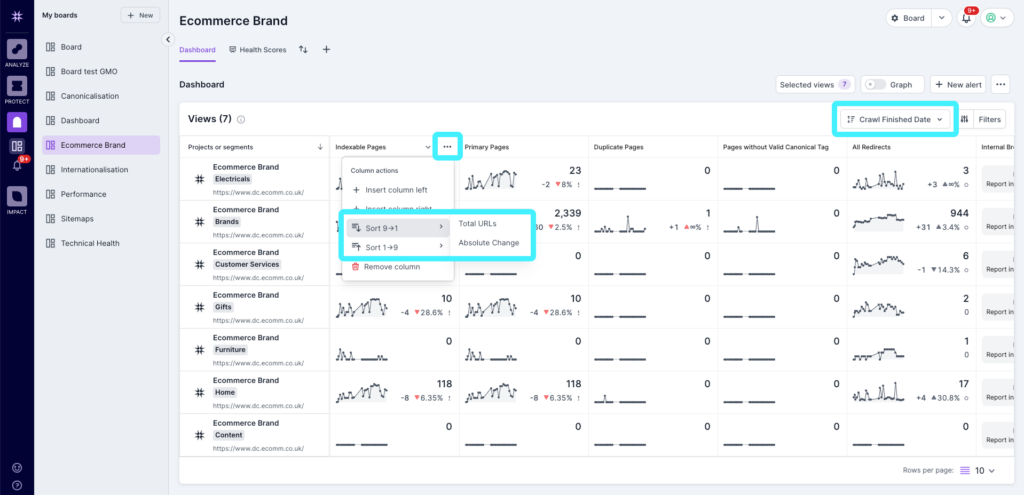
You can also use the sort option on the right hand side to select which column to sort by, and the relevant sort options.
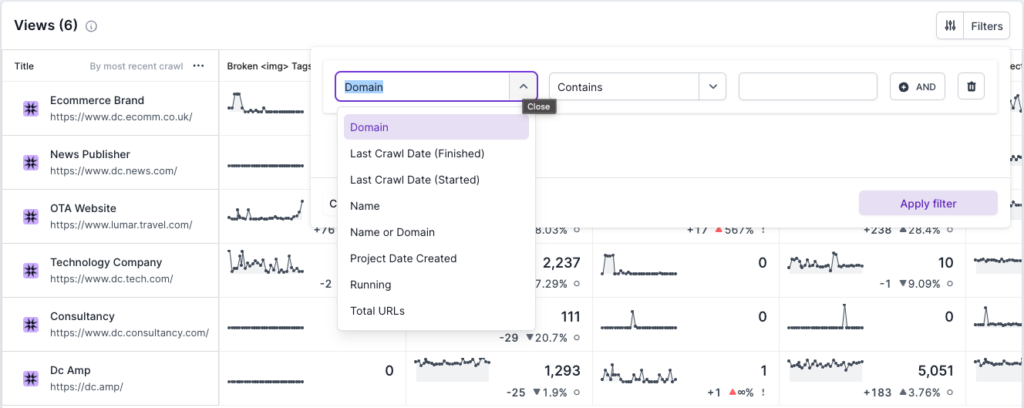
Filtering Dashboards
Click on ‘Filter’ at the top right of the dashboard table to access the filter options. You can use AND/OR tools to hone in on the specific data that’s important to you. For example, you can use this feature to filter the dashboard a specific set of domains.
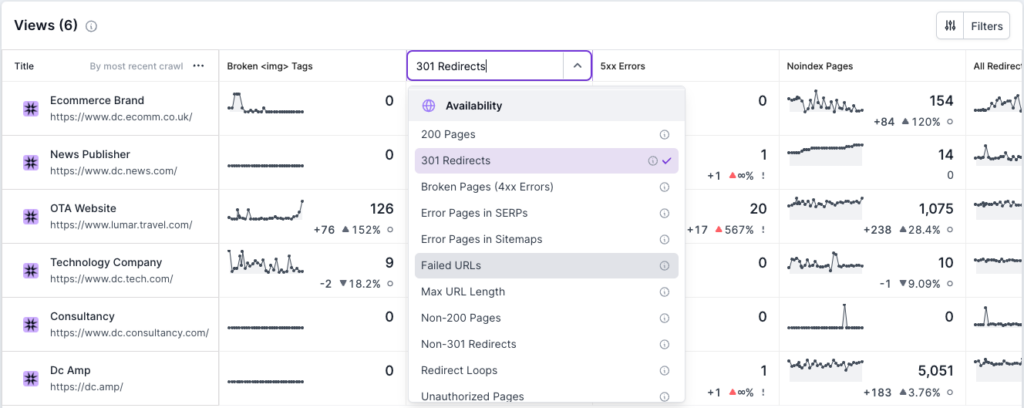
Changing Columns
You can also change the metric that appears in table columns. Simply hover your mouse over the column you want to change and click ‘edit’. You can then choose from any of the default Lumar reports. You can choose up to 15 columns of metrics to appear in each row.
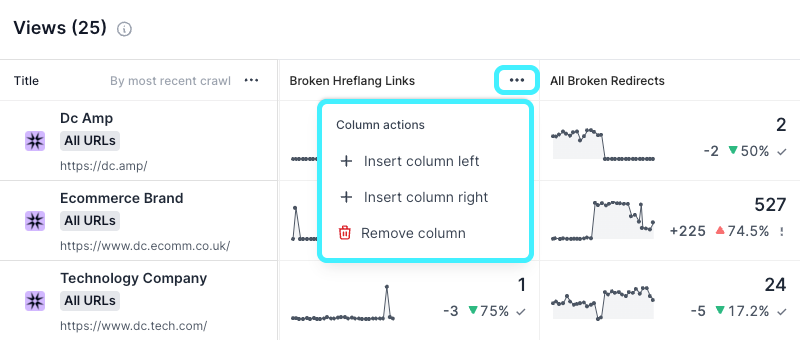
Adding or Removing a Column
Monitor makes it easy to customize your dashboard to quickly look at what is most relevant to you. If you click on the three dots on the right of a selected column, you can choose to add a new column to the left or the right of the one you selected (up to a maximum of 15), or delete it all together (down to a minimum of 1). This gives you more flexibility in creating a dashboard view that serves you best.
Comparing Metrics Across Views
At the top of the dashboard, you’ll see a toggle that allows you to switch on a graph to compare specific metrics across different views.
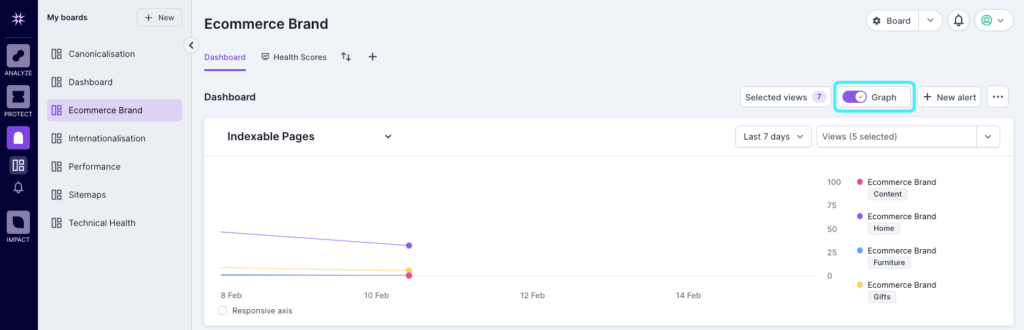
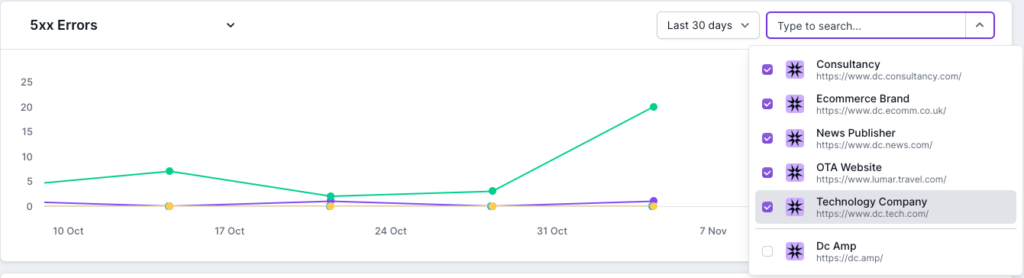
Use the drop down in the top left of the graph to change the metric, and the drop down in the top right to select up to 10 views that will appear in the graph.
By default, the last 30 days will be shown on the graph, but you can change this to the last 7 days, last 90 days or last 6 months, using the options in the middle. One thing to note here is that we currently show 30 data points per trend, so when comparing different data sets it’s important to have crawls of similar regularity (i.e. daily or weekly) in the graph.
Renaming, Duplicating & Deleting Dashboards
To rename a dashboard, click on Board Settings at the top of the screen and you’ll be able to update the name of the board accordingly. Once you’re finished, just click save in the top right of the screen.
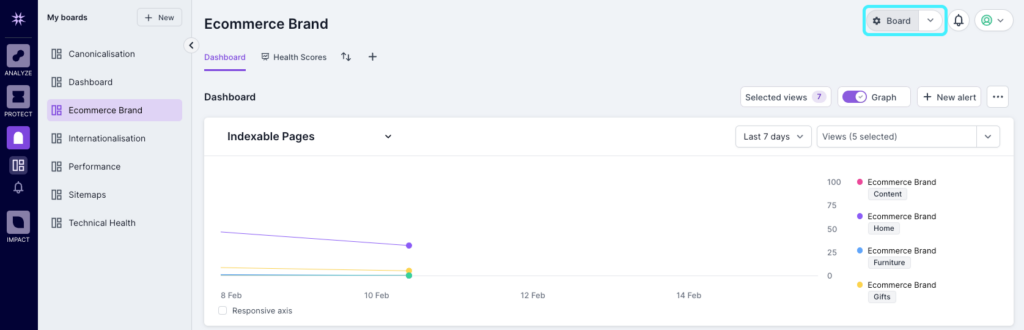
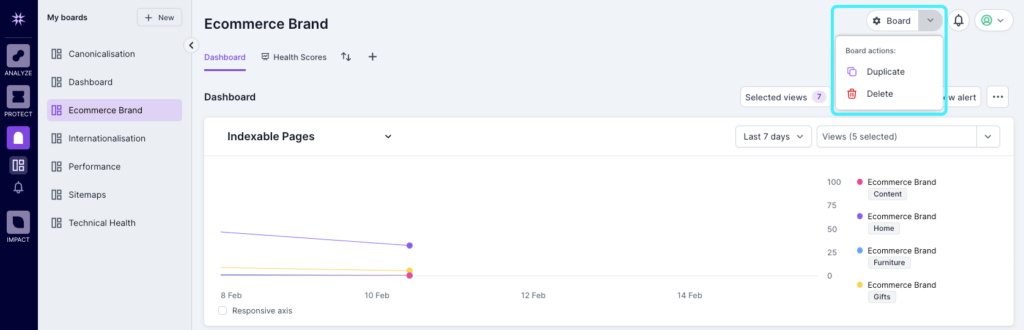
To duplicate a dashboard, go into the board that you want to duplicate, click on the down arrow next to Board Settings at the top right of the screen and select duplicate.
From the same location, you can also delete a dashboard.
Monitor Health Scores
If Health Scores are part of your plan, you can now easily monitor them across your entire portfolio of websites, all in one place. This helps you direct your attention to where it matters most so you can prioritize effectively. Monitor allows you to create a Health Scores dashboard to give you a high-level overview of each of your websites’ technical health over these six important areas:
- Availability – How many of your pages are available to search engines?
- Discoverability – How many of your pages are in Google’s search engine results pages?
- Uniqueness – How many of your pages are duplicates?
- Indexability – Can search engines index your pages?
- Rankability – Of the pages appearing in SERP, how many are actually driving visits?
- Experience – How many of your pages are not delivering a great user experience, and therefore unlikely to convert?
You can find out more about health scores and how they are calculated here.
Custom Alerts
Monitor allows you to create custom alerts for the metrics that matter most to you, so you can be notified when core thresholds are breached. Alerts are available in-app, and also via push notifications to email, Slack and Teams.
Find out more about custom alerts, including how to set them up.
Find Out More
If you’d like to take a look at Monitor, request a demo today.


