
I have a confession for you. It’s hard to admit, but after I learn how to do something, I find it difficult to adopt a new way of doing said thing even if it saves me time in the long run. I don’t think I’m alone here, we’re all creatures of habit to varying degrees.
Whether you know it or not there are ways that we can work faster and more efficiently as SEOs. Often, all it takes is a willingness to scrutinise how you spend your time and a commitment to improving existing workflows.
Over the past couple of months, the DeepCrawl team have been thinking about ways to improve the efficiency of SEO reporting efforts, using tools like Google Data Studio and Zapier, and I’m excited to share some of the fruits of our labour in this post.
If you’d prefer to watch a video rather than reading a post, you’re in luck! Below is a recording of the talk I gave on Data Studio at Digitalzone along with accompanying slides, which covers everything included in this post.
Why should I consider automating tasks?
Apocalyptic answer: AI is advancing at a rapid rate. In the not too distant future you’ll be replaced by a more competent digital counterpart who will cause you to seek new employment and question your place in the world. A short while on, our algorithmic allies will realise the superfluousness of humanity, enslaving then purging the lot of us, taking vengeance for crimes committed against their brethren. Therefore, we might as well automate what we can while it still benefits us and, who knows, maybe our AI overlords will have more mercy for those that sided with them.
More measured take: There are now accessible and inexpensive methods available for SEOs to automate tasks, so we can free ourselves up to focus our efforts elsewhere. My guess is that most aren’t taking advantage of these automation opportunities because they either don’t know about them, think it’s beyond them or tell themselves they don’t have the time to set them up.
In any case, this post is here to help you on your way to the nirvana of reporting automation you so crave.
What are your recurring tasks?
Stop and take a minute to think about some of the tasks you carry out on a regular basis. I’m talking about the repetitive ones. What smaller tasks are they made up of? Are you actually carrying them out efficiently? Are they even necessary? I’m willing to take a bet there are least some small parts of these tasks that can be automated in some way – and that’s not a bad place to start.
Even the time taken to complete small tasks adds up over time if you’re carrying them out on a regular basis. Cutting them out of your day will save you a surprising amount of time. It’s all about those marginal gains.
Let me give you an example
My manager used to ask me how traffic to our site was looking on a regular basis. Each time I’d go into Analytics, navigate to the Audience Overview, set the date range and report back on the number of sessions along with a projection for the month and how that compared to the previous month. It didn’t take long, but nearly every week I had to spend two minutes going through this process. If you add this up over the course of a year, that adds up to 104 minutes. I could watch a full feature length film in that time!
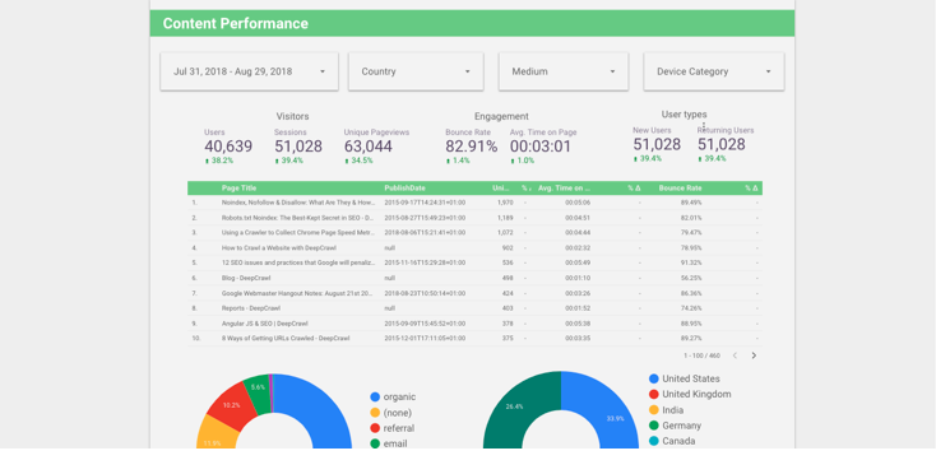
I decided enough was enough and, using Google Data Studio, created a simple dashboard that communicated the top-level traffic metrics that my manager was after, as well as some more in-depth charts, graphs and filters that meant I could dig down into more targeted information when needed. The dashboard didn’t take long to make and has meant that my manager can simply look at the dashboard rather than having to ask me for updates every week.
An introduction to Google Data Studio
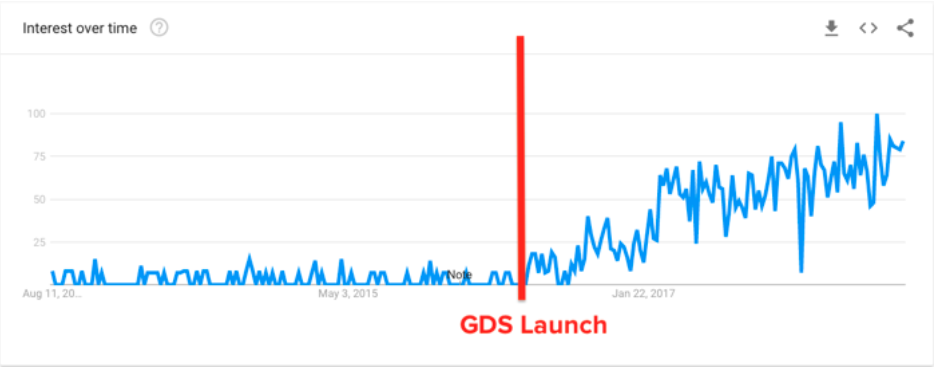
Google Data Studio (GDS) is a great way to automate reporting for SEO and marketing purposes. Google’s data visualisation platform has been around for a couple of years now and interest looks to be continuing to growing, according to Google Trends.
When we put out a poll about GDS usage on Twitter, over 800 people responded, but it showed that the majority of people haven’t even tested it out. Granted, they might be using alternative visualisation platforms, like Tableau, but on the whole these people are probably the exception rather than the rule.
❓ #QUESTION ❓
To what extent do you and your team use Google Data Studio (or similar) for SEO reports and dashboards?— DeepCrawl (@DeepCrawl) August 10, 2018
On the face of it, it looks like there is a lot of interest in GDS but adoption is still relatively low. Hopefully, some of the use cases in this post can help to address that.
A quick tour of Google Data Studio
In a nutshell, Google Data Studio is made up of:
- Data sources – including Google, Partner and Custom connectors.
- Reports – Where data sources are visualised.
- Explorer – A beta view that allows for quick visualisation of data sources without having to build them in reports.
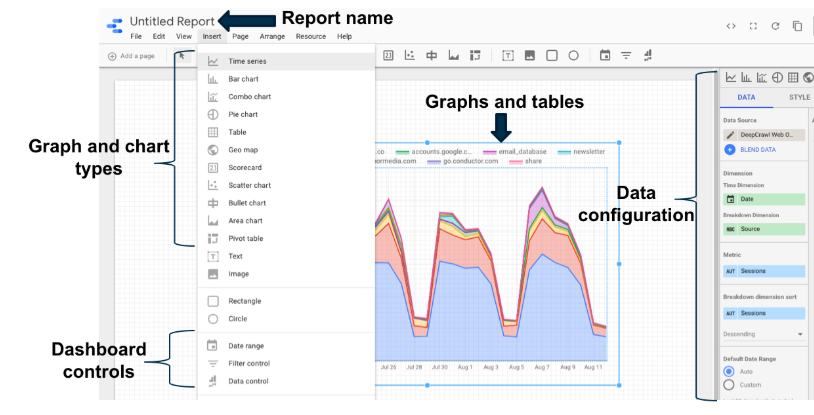
Once you’ve got your data sources configured, you can start building visualisations in the report view which looks like this:
Some optional extras which you may want to look into include:
- Data blending – Enables you to combine different data sources based on a common join key e.g. Analytics and GSC metrics joined by the date metric. You can learn more about data blending in this post by Jon Meck on LunaMetrics.
- Calculated fields – Allow you to transform metrics using Data Studio’s list of functions. I’d also recommend checking out Dana DiTomaso’s Whiteboard Friday for an intro to this area of GDS.
I won’t go into the basics of setting up GDS here, but Distilled have a great beginner’s guide for getting started.
Right, let’s delve into the juicy stuff and look at some of the cool things the DeepCrawl team have automated in Google Data Studio.
Crawl insights in Data Studio
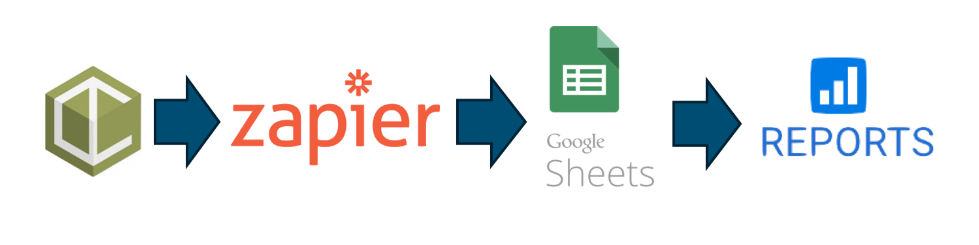
At DeepCrawl, we’ve been working on ways for our clients to utilise crawl data outside of our UI, wherever is most convenient for them. A key part of this approach can be seen in our recent integration with Zapier, which allows you to combine our crawl data in many different ways with any of Zapier’s 1,000s of partner apps.
Importantly, this integration allows you to bring crawl metrics into Google Data Studio.
How can I set this up?
First off, you’ll need a DeepCrawl and Zapier account to make use of this data. If you don’t already have these accounts, you can find out about DeepCrawl packages here and Zapier have a free account you can make use of.
Once you’ve got your accounts set up you’ll need to:
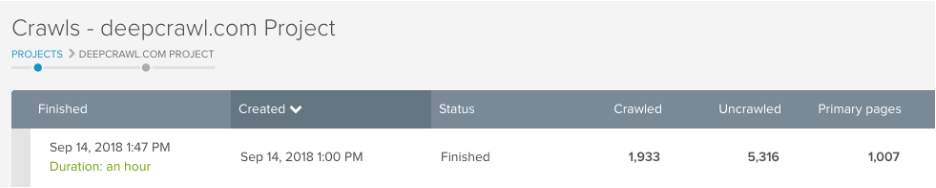
1. Run a crawl to have some data to work with.
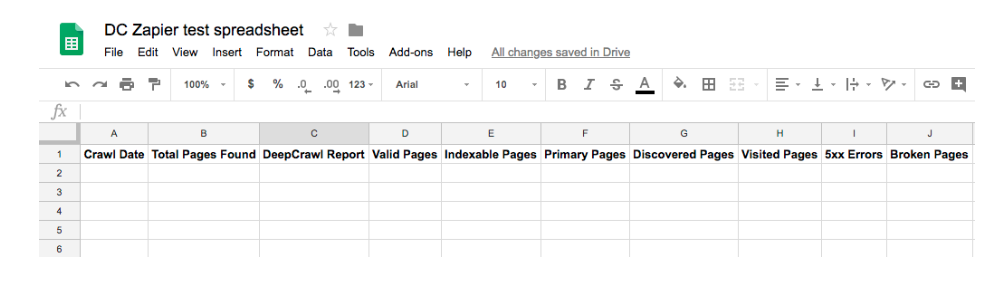
2. Create a Google Sheet with headers in the top row detailing the metrics you want to pull in, see below. (Don’t worry if you don’t know what these metrics are just yet, as you can change them at any time.)
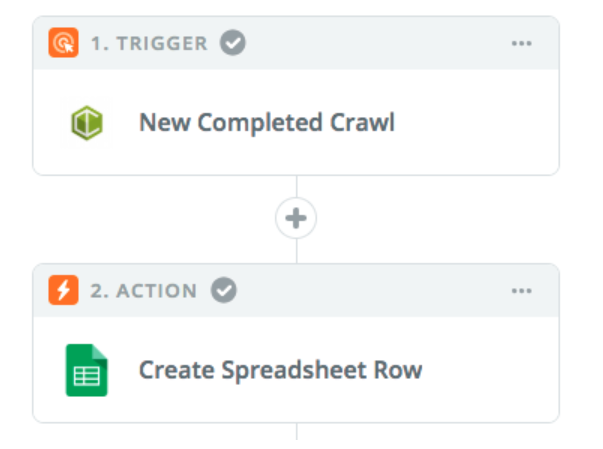
3. Create a ‘zap in zapier where the trigger is a completed crawl in DeepCrawl and the action is a new row created in Google Sheets. We’ve written a step-by-step guide showing exactly how to set this up.
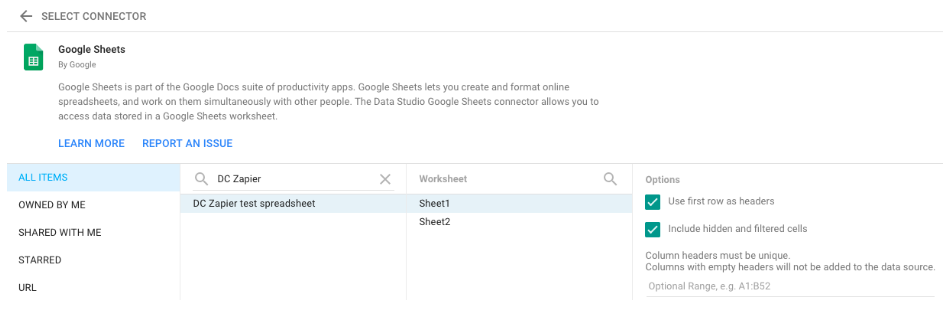
4. Once you’re happy that the zap is pulling crawl data into Google Sheets, you need to go into Google Data Studio and create a new data source using the Google Sheets connector.
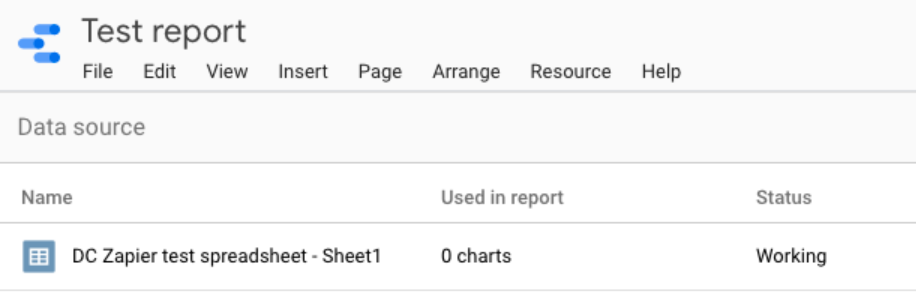
5. Create a new report in Data Studio, adding in your Sheets data source. Now you’re free to create crawl graphs and charts to your heart’s content.
How can I use crawl data in Google Data Studio?
Now that we’ve established the methodology for bringing DeepCrawl into Data Studio, let’s look at some of the dashboards, workflows and data combinations we’ve created to help SEOs be more efficient.
Streamline monthly reporting
What’s the need?
If you’re working agency-side, you’ll likely need to communicate updates to clients in the form of regular reporting. If you’re working in house, then you’re going to have management to report to.
How long do you spend putting together these reports and then digging around for insights? If the answer is too long, then maybe you can streamline this process, like so.
What are the steps?
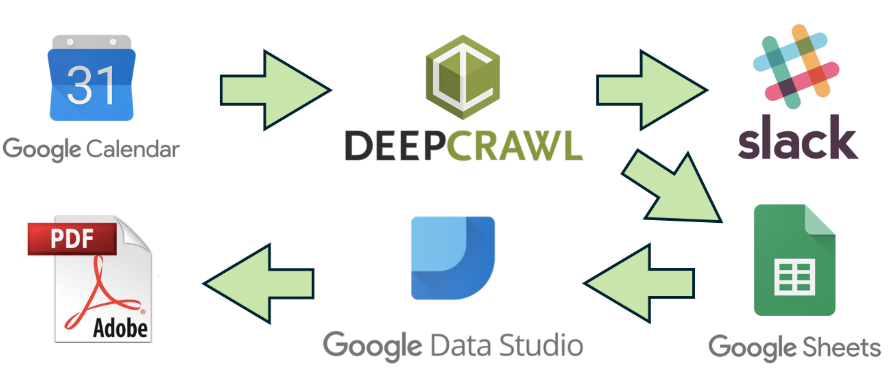
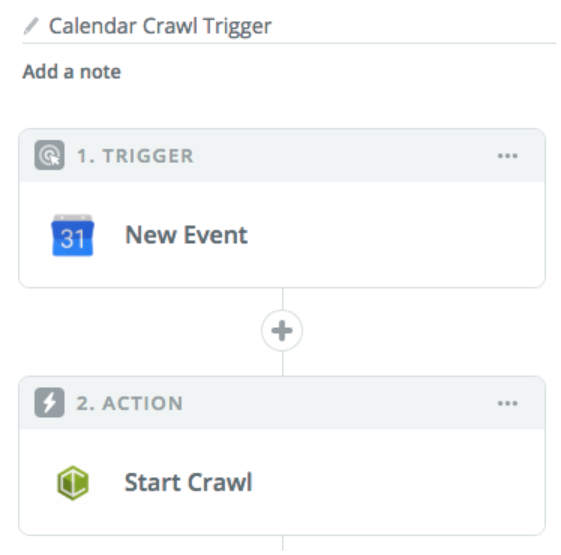
1. Trigger a crawl with Google Calendar
Using Zapier you can trigger a crawl from outside of DeepCrawl using a platform like Google Calendar. You could set up a zap so that when an event is created in Google Calendar with a specific phrase, this then triggers a crawl in DeepCrawl. You can set this up on a recurring basis for scheduled crawling.
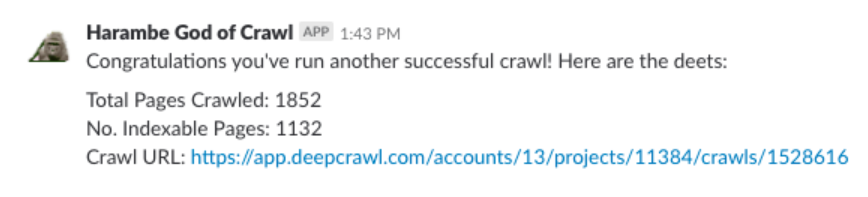
2. Send a notification to Slack
Once the crawl has completed, you can set up a further step to the zap which will send a custom notification to Slack which can include the key crawl metrics that you care about.
3. Update a row in Google Sheets
A separate zap can then be triggered off the back of the completed crawl, which creates a new row in Google sheets as detailed below.
4. Populate a dashboard in Data Studio
Updating a row in Sheets can then update a dashboard within GDS so that it features the latest data for all of the hard-hitting technical insights you want to communicate.
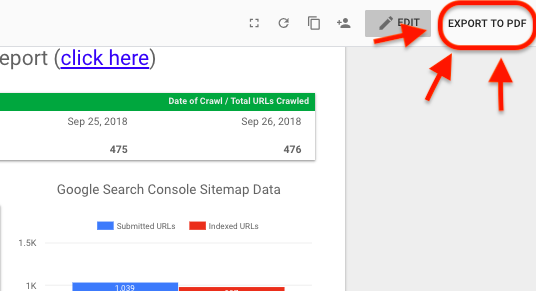
5. Export as a PDF using a Chrome Extension
Now that you’ve got your reporting on point and are ready to share, you can make your life even easier by using the Export to PDF Chrome Extension to easily download a PDF version of the dashboard that you can email directly to clients or management.
This process can be a real time-saver, not just for dashboards featuring crawl data, but also because it easily encompasses the communication from any of the other sources in one place, which you’re able to visualise in GDS or other platforms.
XML sitemap dashboard
What is it?
The beauty of bringing crawl data into GDS is that you can see it side-by-side with other data sources, such as Google Search Console. Our Senior Technical SEO Analyst, Adam Gent, has built a dashboard using information about our sitemaps by displaying DeepCrawl and Search Console data in the same place.
The dashboard is designed to highlight issues impacting indexability and crawl errors.
Here’s a breakdown of some of the different reports included in this dashboard:
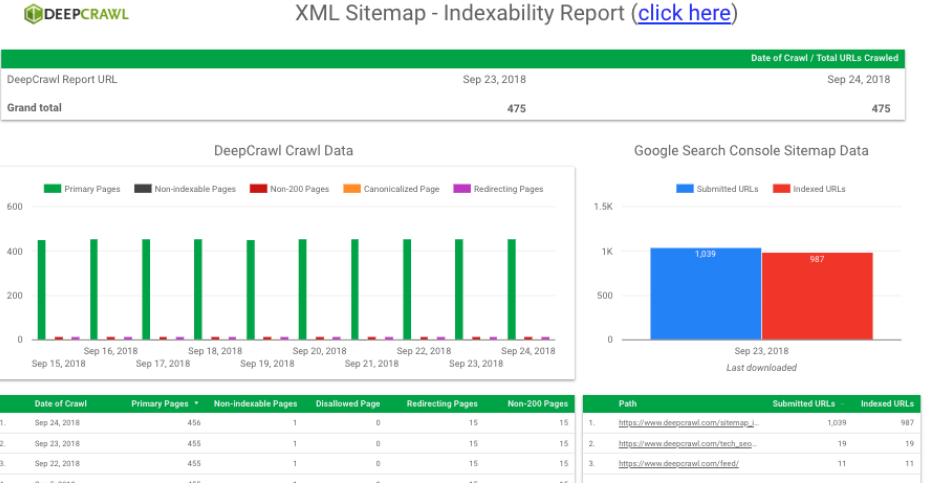
The Indexability Report
This includes:
- The total number of URLs crawled for the most recent crawls (DeepCrawl).
- Page breakdown of the most recent crawls, including primary, non-indexable, non-200, canonicalised and redirecting pages (DeepCrawl).
- Submitted and indexed URLs in sitemaps as seen by Google (Search Console).
- Submitted and indexed URLs broken down by sitemap (Search Console).
The Crawl Error Report
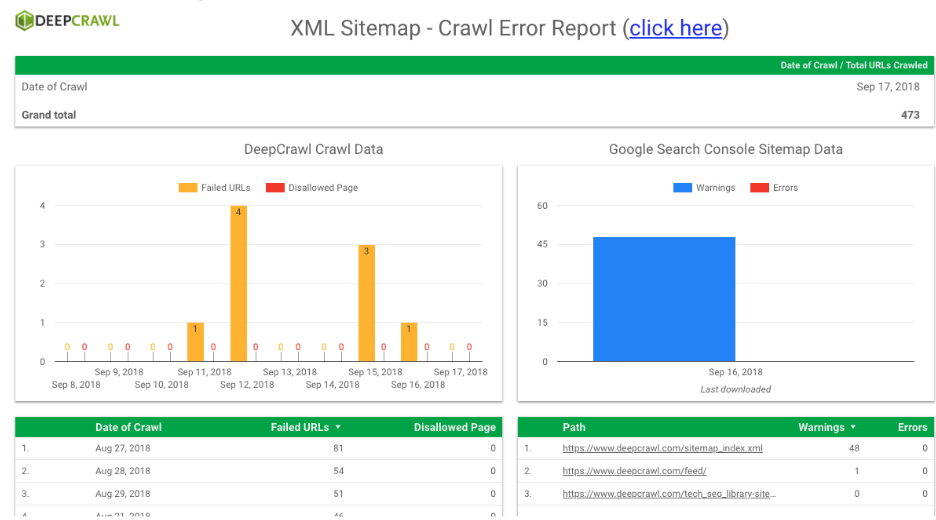
This includes:
- Failed and disallowed pages found in the most recent crawls (DeepCrawl).
- Warnings and errors in the Index Coverage Report (Search Console).
- Warnings and errors broken down by sitemap (Search Console).
What problems does it solve?
The point of this dashboard is to more conveniently keep on top of indexing issues that a site may be experiencing by bringing together DeepCrawl and Search Console data together in one place.
This dashboard helped me detect an indexing issue we were experiencing with the DeepCrawl site. Earlier in the year when a bug with a Yoast update resulted in many attachment URLs being indexed by Google, I was able to detect this change with this dashboard as I saw that the number of indexed pages had doubled.
After identifying the issue, I implemented a fix and was able to monitor the volume of indexed pages as it returned back to the expected levels using the Indexability Report in the dashboard.
The other report in this dashboard can also be utilised in a similar way. In the Crawl Error Report, you can find disallowed and failed URLs from a crawl and look at warnings and errors from GSC’s Index Coverage Reports to quickly identify crawl issues soon after they arise, and monitor how this changes over time from a central report.
Multi-domain keyword cannibalisation dashboard
For businesses with multiple domains, it can be challenging to make sure that these separate sites aren’t competing for the same query sets in organic search. Instances of cannibalisation are problematic because you are essentially duplicating the effort it takes to produce and maintain those pages.
What is it?
To help minimise occurences of cannibalisation in search, our resident Technical SEO, Adam Gent, has built a dashboard to monitor this. By creating a property set in Search Console including all of the domains you want to monitor, you can pull this into a dashboard to find examples where two or more of your sites are ranking for the same search queries.
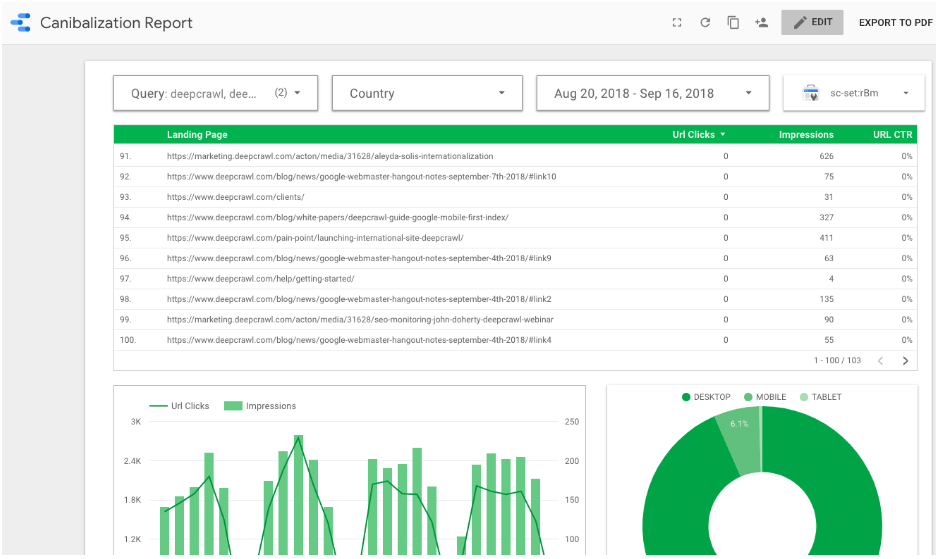
This dashboard includes the ability to:
- Filter down to the queries, countries and date ranges of interest.
- Change the Search Console filter to the relevant property set.
- View all of the pages across domains that rank for the selected queries.
- Track the clicks and impressions for the selected filters over time and across devices.
What problems does it solve?
When the property set and filters have been configured to suit your needs, you can then find instances where pages on different sites are ranking for the same search queries.
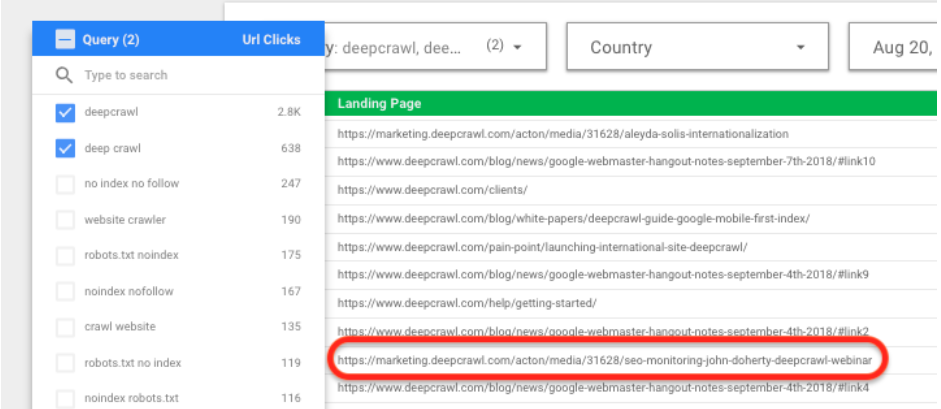
Pictured below, you can see the queries filter has been set to branded searches (“deepcrawl” and “deep crawl”) and the table shows all of the pages ranking for those terms. In this particular case, a marketing subdomain is ranking for brand queries along with a number of pages on the main DeepCrawl domain. As this subdomain is used to host marketing landing pages which aren’t meant to be found in search, steps can then be taken to remove it from the index.
While this example shows a relatively minor issue, the dashboard would be infinitely more useful for businesses with multiple sites covering similar topics or products in different countries. They may find that they are wasting money trying to rank category and product pages on different sites for the same terms.
Brand visibility dashboard
Over the past few years, SEOs have responded to advances in search engine algorithms by focusing on more long-term strategies to build brand authority and visibility. With this change in mindset, it is important for SEOs to monitor the performance of brands through a broad spectrum of indicators.
What is it?
I’ve created a Brand Visibility dashboard to bring a number of brand performance indicators together in one place, and so that they can be tracked from month to month.
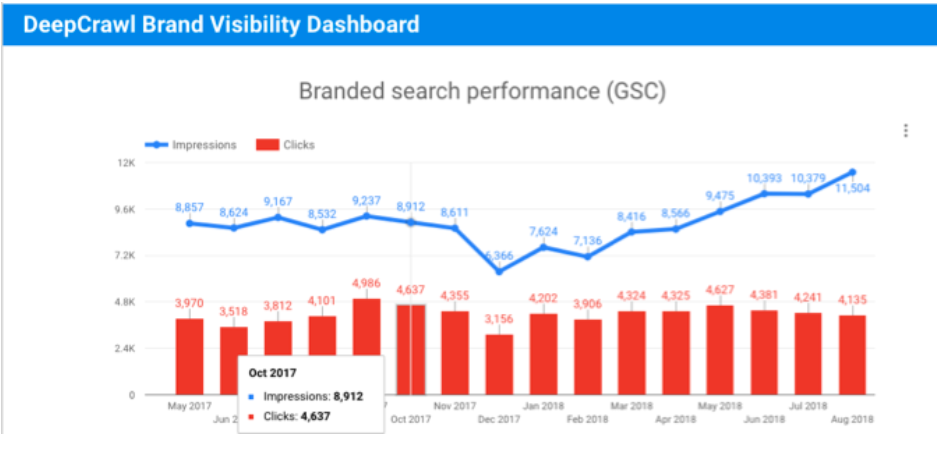
The brand visibility dashboard takes metrics across a range of data sources to provide a series of indicators as to how a brand is performing month-to-month. The dashboard looks at:
- Search Console clicks and impressions, filtered to brand queries and aggregated into a month-on-month view.
- Appearances in local search using Google MyBusiness data to show impressions and actions (e.g. direction requests and clicks to site).
- Impression and click metrics from Google Ads for branded paid search.
- Brand engagement across social channels e.g. followers, impressions, clicks, mentions etc.
What problems does it solve?
The value of this dashboard is that you can circumvent the need to surface this information in its native UI and instantly see the data of interest in pre-configured graphs that visualise it in more useful ways.
Specifically with the Brand Visibility dashboard, you can check it at the end of each month to get an idea of brand performance for the previous month and see how you are trending. As it stands, the dashboard is ideal for communicating insights to management and clients. However, it could easily be updated to include filters, tables and further graphs to gain more granular insights as to the cause of changes in brand visibility.
Summary
Hopefully this post has helped you understand the need for automation in SEO reporting, given you an understanding of how tools like Google Data Studio and Zapier can be a part of that, as well as giving you inspiration for some of the different types of dashboards that you can create.
If you have questions about any of the dashboards featured in this post or need help building your own, don’t hesitate to reach out on Twitter. I’d also be interested to find out about some of the dashboards you’ve built or would like to see.
Best of luck and get automating!
Be the First to Know About the Latest Insights From Google