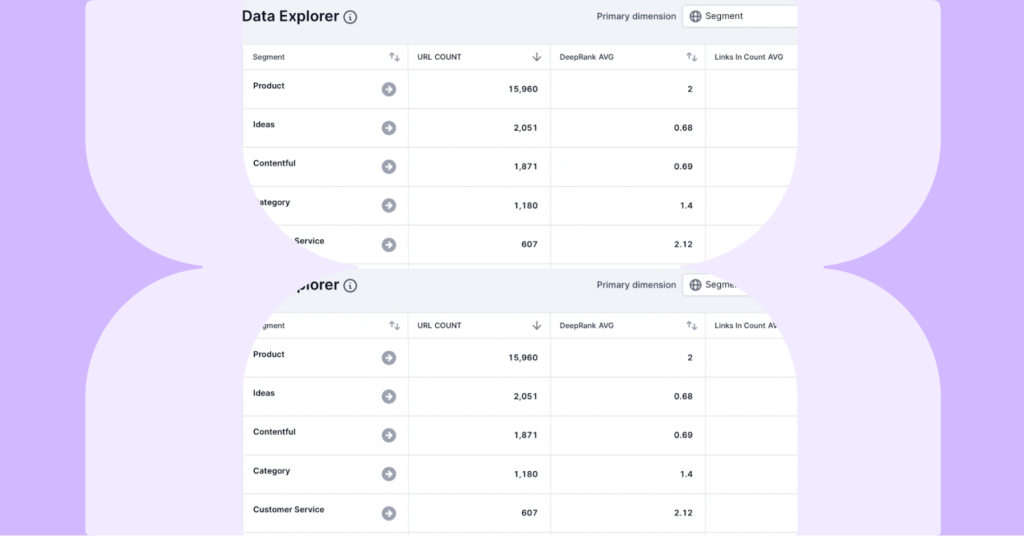

The new Data Explorer enables our customers to summarize millions of rows of crawl data in seconds and streamline your workflow. This new feature will allow our customers to gain unique insights into their crawl data and quickly communicate SEO issues to other stakeholders.
What is the Data Explorer?
The Data Explorer allows our customers to summarize crawl data and calculate simple aggregate functions. The feature uses a new service that aggregates data by specific dimensions.
Why use Data Explorer?
The Data Explorer allows our customers to:
- Save time: It summarizes millions of rows of data seconds.
- Summarize crawl data: Data Explorer can summarize millions of rows of data using simple aggregate functions.
- Communicate to stakeholders: Key SEO issues can easily be spotted and shared with stakeholders.
How does Data Explorer work?
The Data Explorer acts as an advanced pivot table that allows you to calculate aggregate functions for numeric metrics (DeepRank, internal link count, backlink count, log hits, etc.).
We allow our customers to group crawl data using the following dimensions:
- HTTP Status Code
- Level
- Segments
- Path
The technology we use currently only calculates the following aggregate functions for relevant metrics:
- Sum
- Average
- Count
Our customers can calculate aggregate functions on any numeric metric in our system. A list of metrics and reports can be found here.
Data Explorer scenarios
We have provided a few common scenarios to help show off the unique data insights available to SEOs.
Internal Link Analysis
In this scenario, a client wants to understand any internal link opportunities available to optimize pages within the /appliances/ directory.
Analysis
Data Explorer is used to quickly summarize the internal linking metrics around important page types using segments. To understand the internal linking of the page types, the SEO analyst used the following metrics and aggregate functions:
- URL, Count
- DeepRank, Avg
- Links In Count, Avg
- Links Out Count, Avg
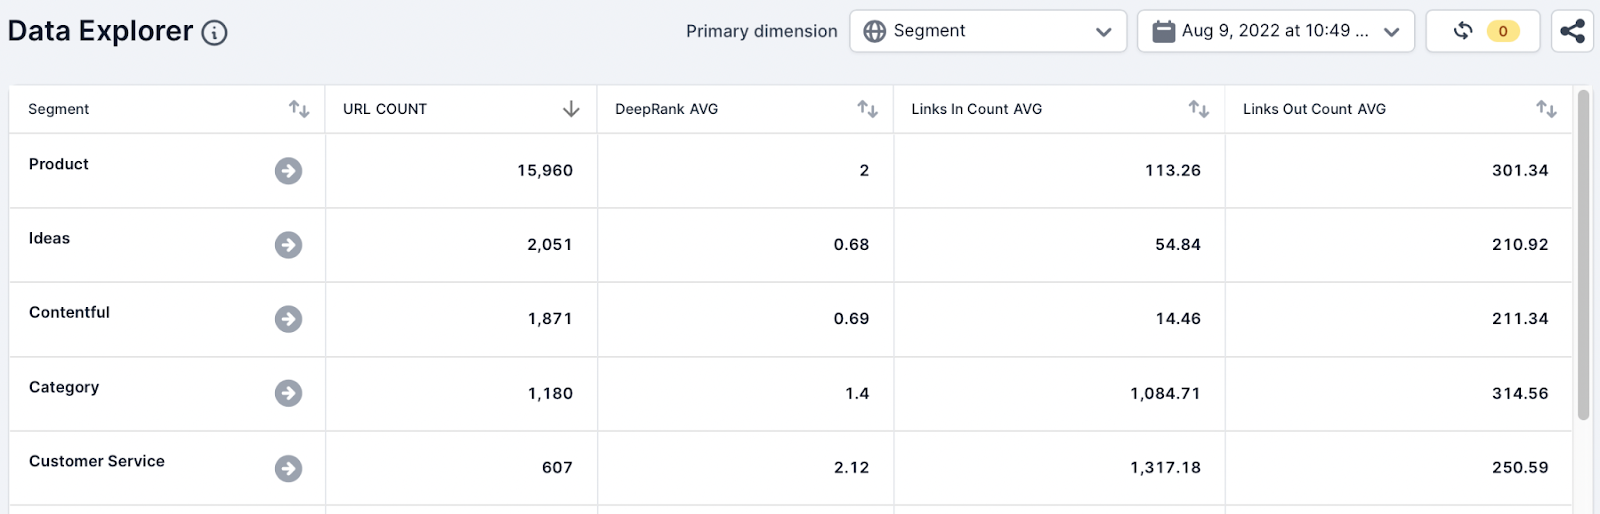
Action
In a few seconds, the SEO analyst has identified that the average DeepRank and the Followed Links In Count for the appliances pages are lower compared to other important page types in our crawl.
Canonical link signals
In this scenario, a client has raised that canonicalized parameter URLs are being found to be indexed by Google.
Analysis
To understand any canonical link signals inconsistencies across the parameter URLs, the SEO analyst added a new Parameter segment to Example. Then they used the following metrics and aggregate functions while selecting the Segment dimension:
- URL, Count
- Canonical link In Count, Sum
- Followed Links In Count, Sum
- Sitemaps In Count, Sum
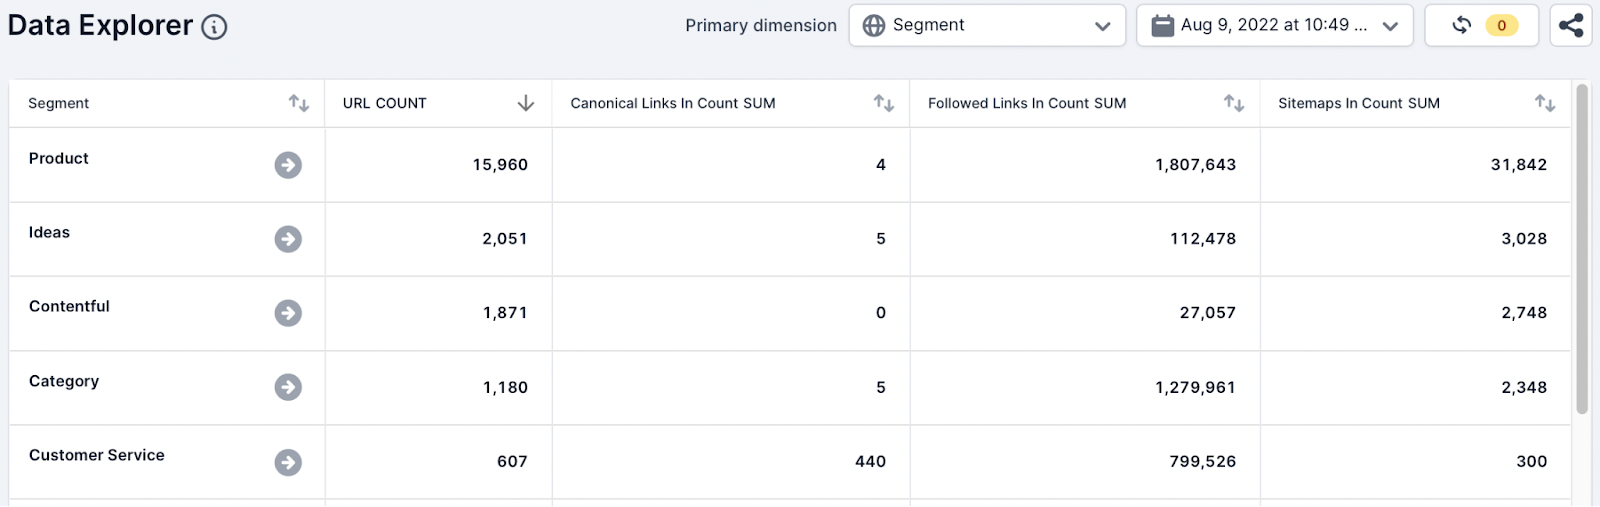
Action
The team identified both followed links pointing to the canonicalized parameter URLs. Google has spoken in detail about the canonicalization algorithm and mentioned that PageRank (links) is a signal. The team suspects that internal linking is what could be causing Google to ignore canonical tags.
The SEO team can also easily communicate this summary with the development team and other stakeholders.
Sitemap analysis
This scenario can be used to segment XML Sitemap issues for important page types across the website.
Problem
In this scenario, an SEO team wants to understand why pages within the /appliances/ directory are not being discovered and crawled quickly by Google.
Analysis
To analyze the sitemaps in the crawl, the team have added the following metrics and aggregate functions while selecting the Segment dimension:
- URL, Count
- Sitemap In Count, Sum,
- Followed Links in Count, Sum
- DeepRank, Avg
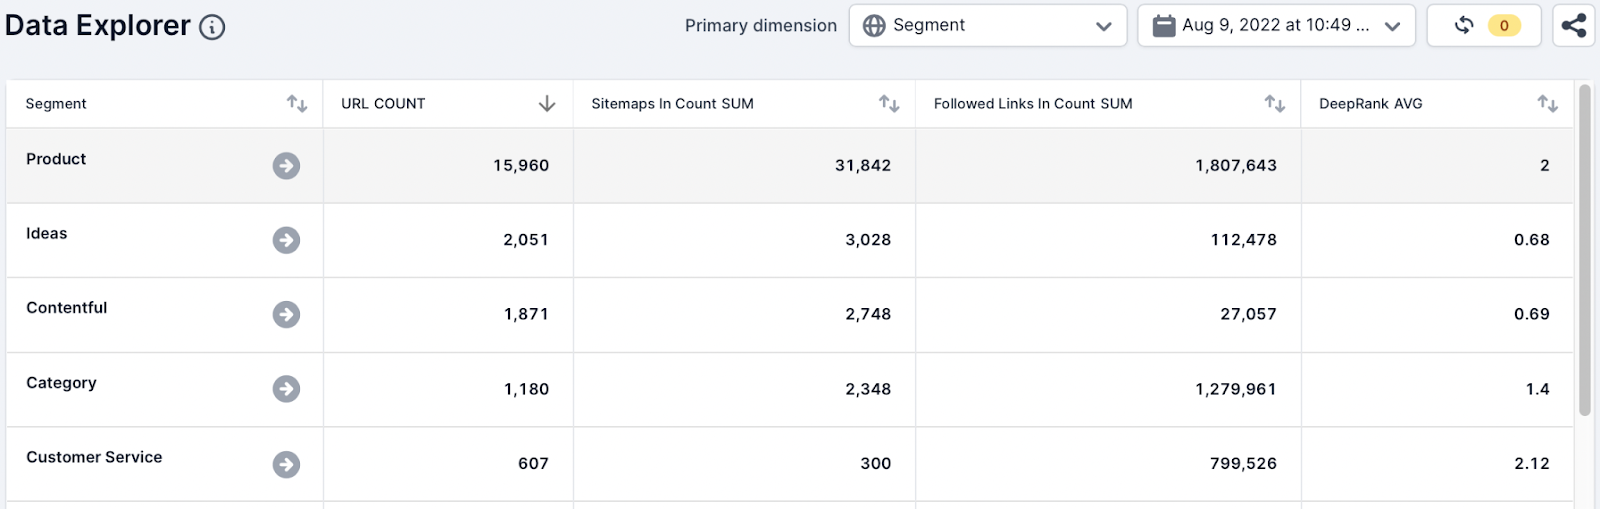
Action
The number of appliance URLs being found in sitemaps is smaller than the number of URLs found in the crawl. This indicates to the team that not all the new appliance pages have been added to sitemaps.
In seconds the team identified that the new pages need to be added to sitemaps and submitted to Google.
The SEO team can easily communicate the scale of the issue to other stakeholders.
Broken Page Analysis
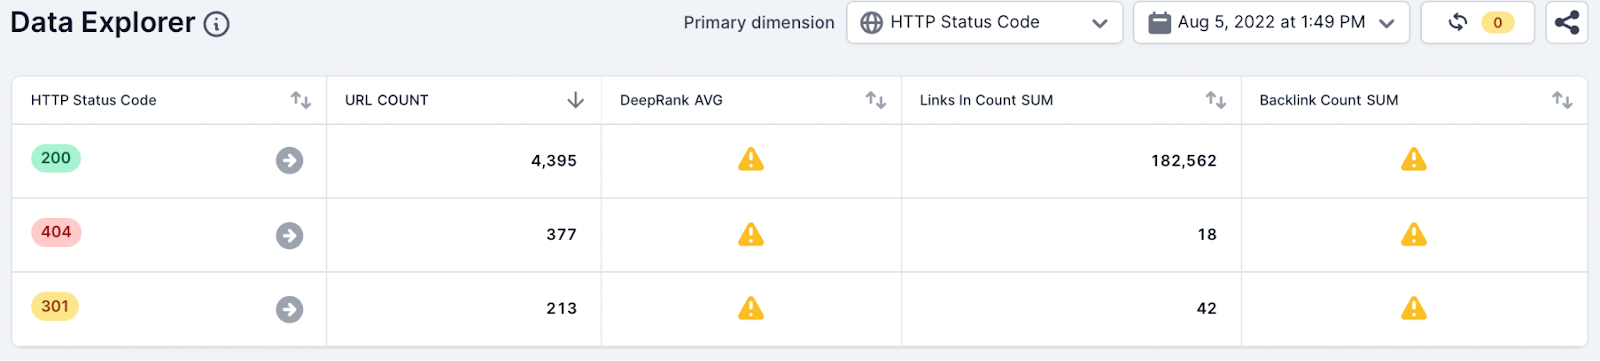
In the scenario, the team wants quickly to identify broken 4xx pages with any SEO value.
Analysis
To do this the team used the following metrics and aggregate functions and selected the HTTP Status code dimension:
- URL, Count
- Analytics Visits, Sum
- Backlink Count, Sum
- Backlink Domains Count, Sum
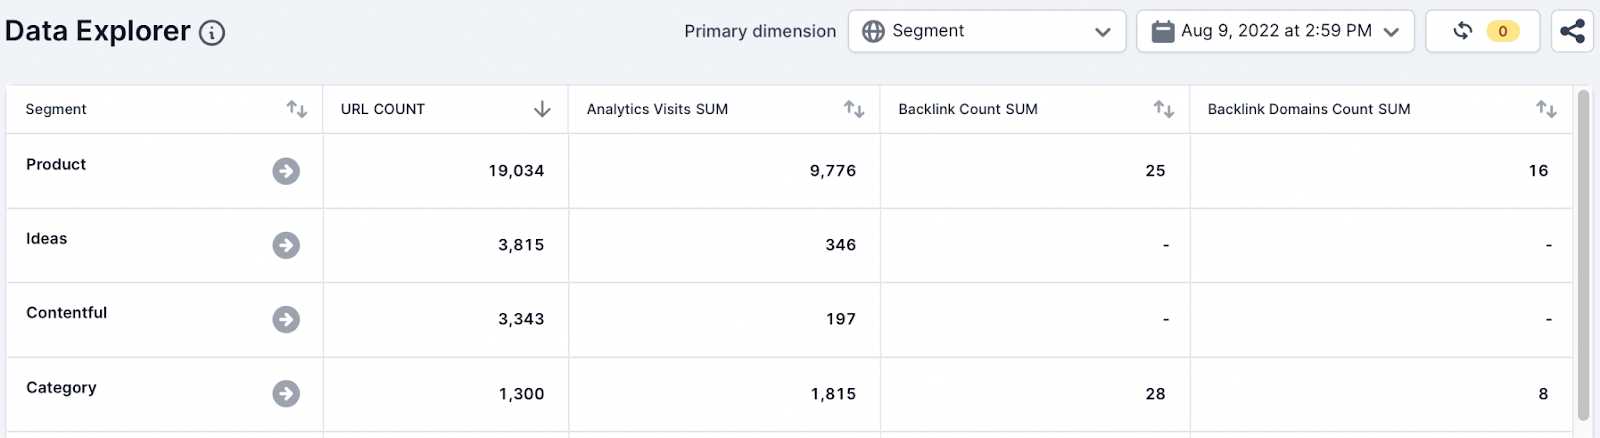
Action
As you can see from the list screenshot above the team has quickly identified broken pages with traffic and backlinks (SEO value).
This data should still be investigated within Example and third-party tools to identify the pages to 301 redirect. The SEO team can also quickly summarize and communicate the available opportunities to the wider team in seconds.
Web Vital Analysis
In this scenario, the SEO team wants to quickly understand Core Web Vital metrics across the most important pages on the website.
Analysis
The SEO team updated the table to include the following metrics and aggregate function and selected the segment dimension:
- Time to First Byte (TTFB), Avg
- Largest Contentful Paint (LCP), Avg
- Cumulative Layout Shift (CLS), Avg
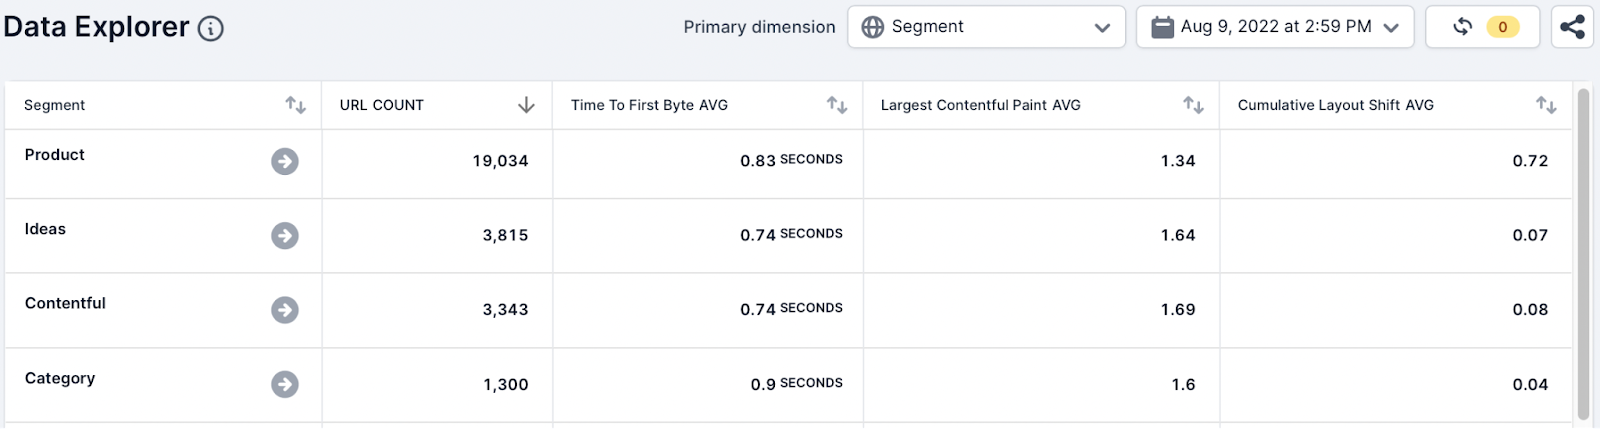
Action
The team found that the TTFB average for all the segments is outside the “good” criteria that Lighthouse and Google recommends. Also, there are page types which are showing a poor average score for the CLS metric.
This data quickly shows that further investigation is needed to understand which pages are poorly performing but this table can be used to summarise and communicate these problems with internal stakeholders.
Crawl Analysis
The team wishes to understand if there are any crawl errors found in the crawl and quickly summarize the information to communicate to the engineering team.
Analysis
Using the default Data Explorer view the team selected the HTTP Status Code dimension.
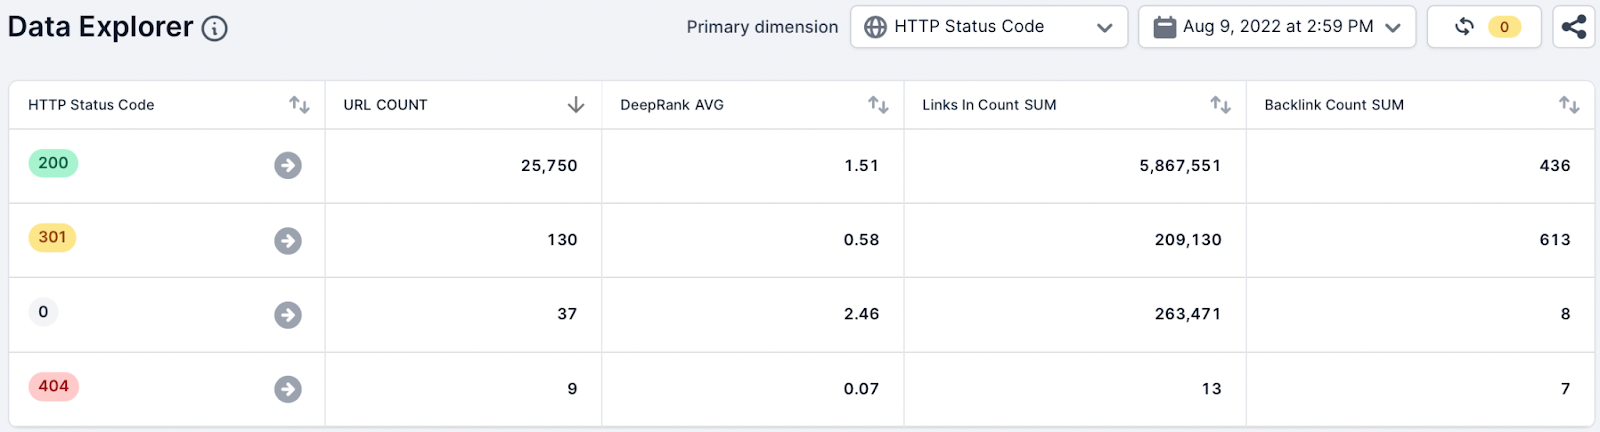
Action
The team can quickly identify crawl errors that were found in the crawl using the SUM aggregate function and the Internal Links In Count metric.
This data can then be quickly summarized and communicated to internal stakeholders.
How Can I Get Started?
Our team will first roll out the Data Explorer for all customers with the segmentation feature, and then give access to all our customers.
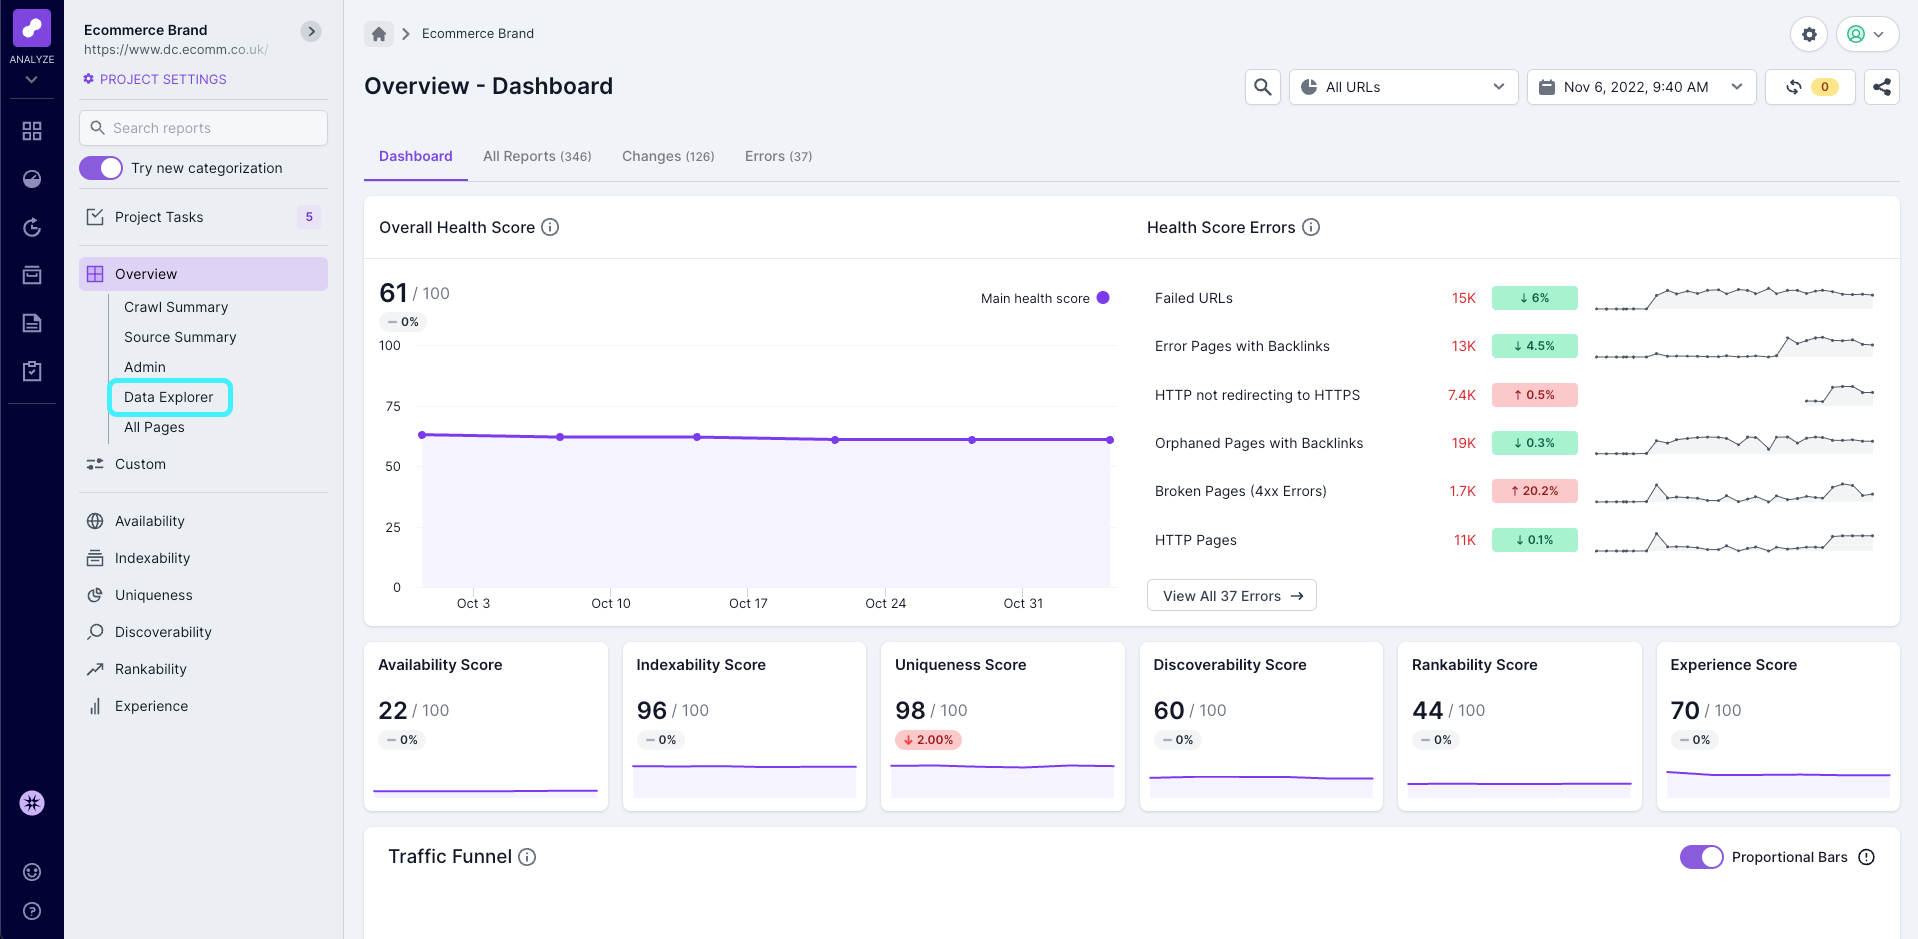
Once you have access you will be able to see Data Explorer in the left hand navigation, in the Overview section.
Frequently Asked Questions
Do you plan to release other enhancements?
We’re always looking to improve features and feedback from our Beta testers has already been valuable in improving the Data Explorer.
Please provide feedback through the feedback form or your Customer Success Manager.
Is the summarized data available in the API?
Yes, all the aggregate data is available in the API. Read our API docs for more information.
Summary
The Data Explorer will help our customers save time and summarize important technical SEO issues across millions of rows of data.