
Helping our customers improve the technical health of their website is at the heart of our business at Lumar — and we’re constantly working on creating even faster, easier ways for our customers to execute their SEO and accessibility strategies at scale to improve their websites’ performance. That’s why we made segmentation a foundational element of the platform.
What is Segmentation?
Segmentation allows you to easily conduct analyses on different page types across your website and efficiently identify SEO or accessibility issues and opportunities.
With segmentation you can:
- Create custom segments based on Lumar’s extensive metrics
- Identify SEO and accessibility issues quickly by only focusing on priority areas of your business
- Discover and monitor SEO or accessibility trends in priority areas of your website.
- Export segment data into Google Data Studio using the Lumar Connector to create customized dashboards
For example, you can create segments for different product categories on your website or for different country/language versions.
Getting Started
Access to the new application is only available for enterprise clients. To find out more, please speak to one of our account executives.
There are 3 key steps to using segmentation:
- Create your segments
- Run a crawl
- View the reports
Watch an overview of setting up Segmentation in Lumar below, or read on for step-by-step instructions.
How Do I Access Segmentation in Lumar?
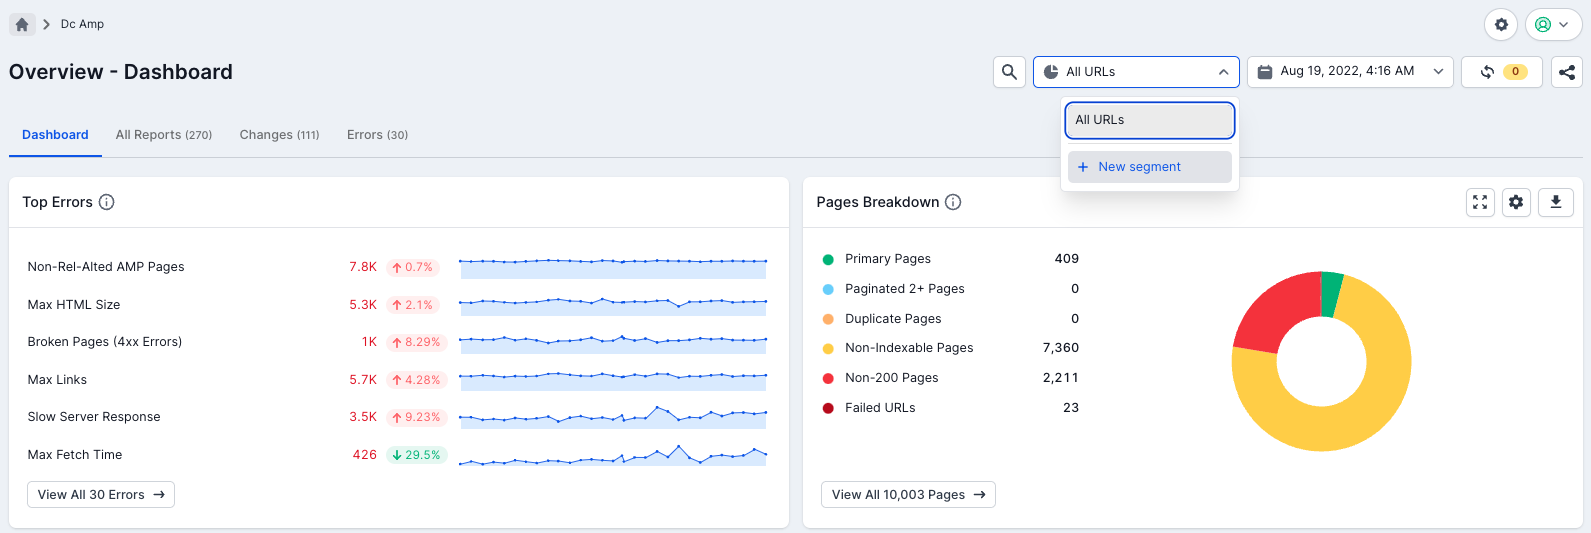
You can access segmentation from the project dashboard or any of your Lumar reports. Just click on the ‘All URLs’ option at the top of the page on the right.
How Do I Create Segments?
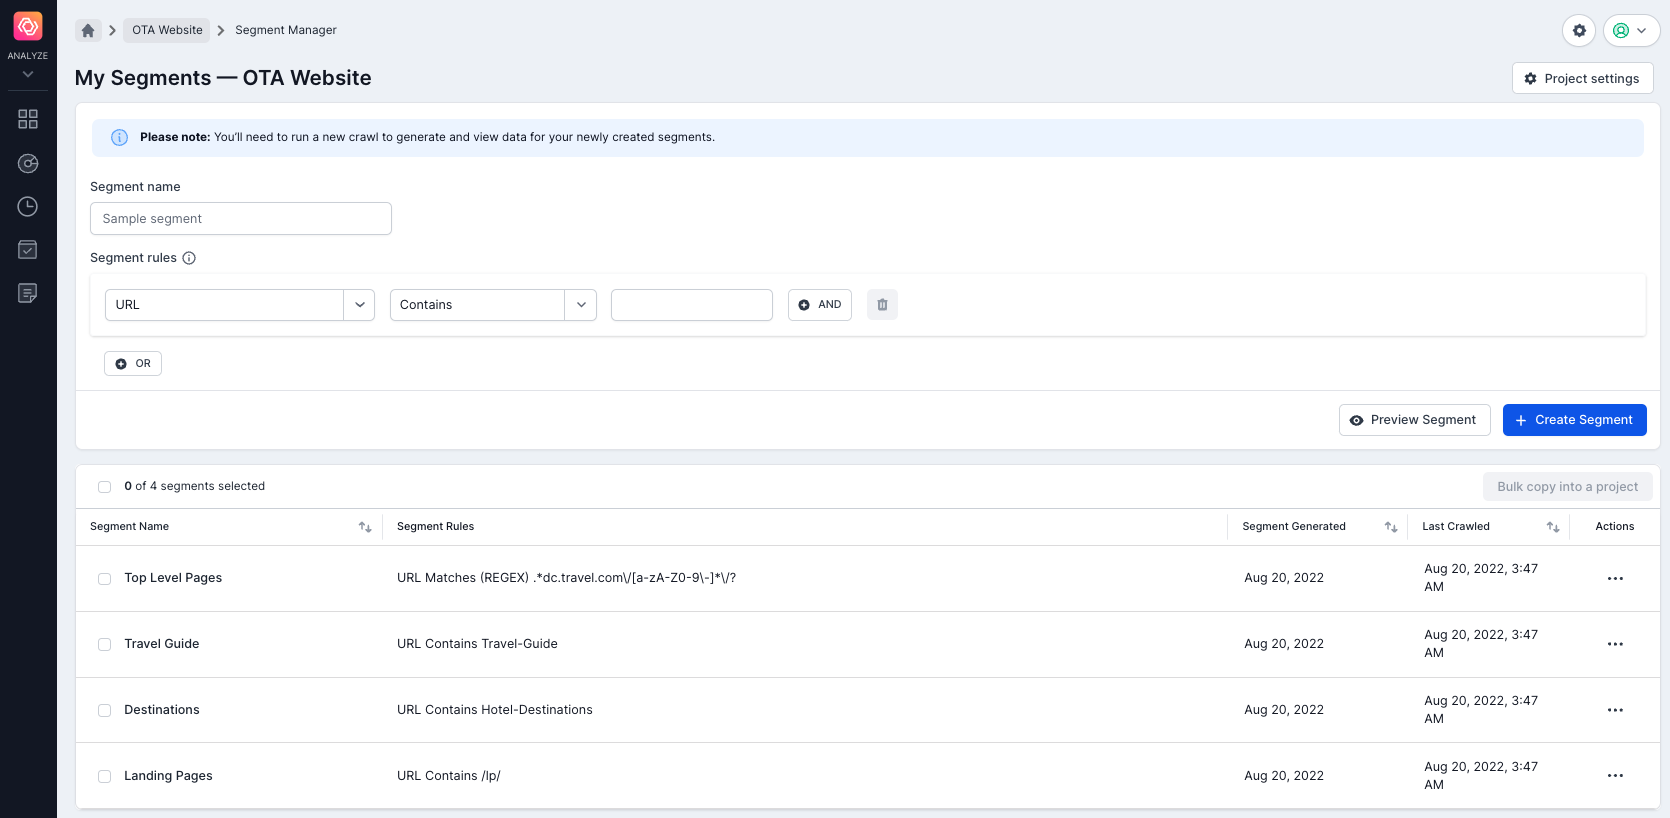
The first time you access segmentation in Lumar, you’ll only have the option to create a new segment. Click on that link and you’ll be taken to the My Segments page.
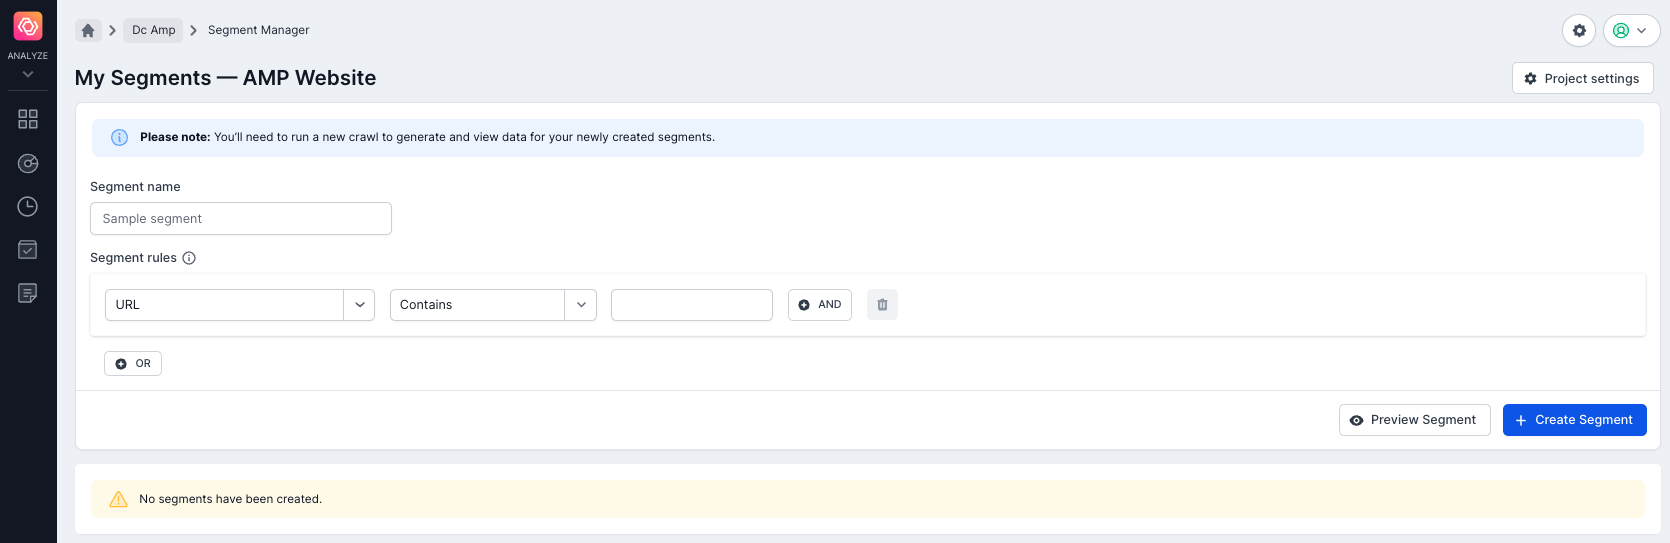
A segment must have:
- A name
- At least 1 rule defined
You can create segment rules with URLs and any other metric available in Lumar reports. You can also use RegEx validation (see our hints and tips section below).
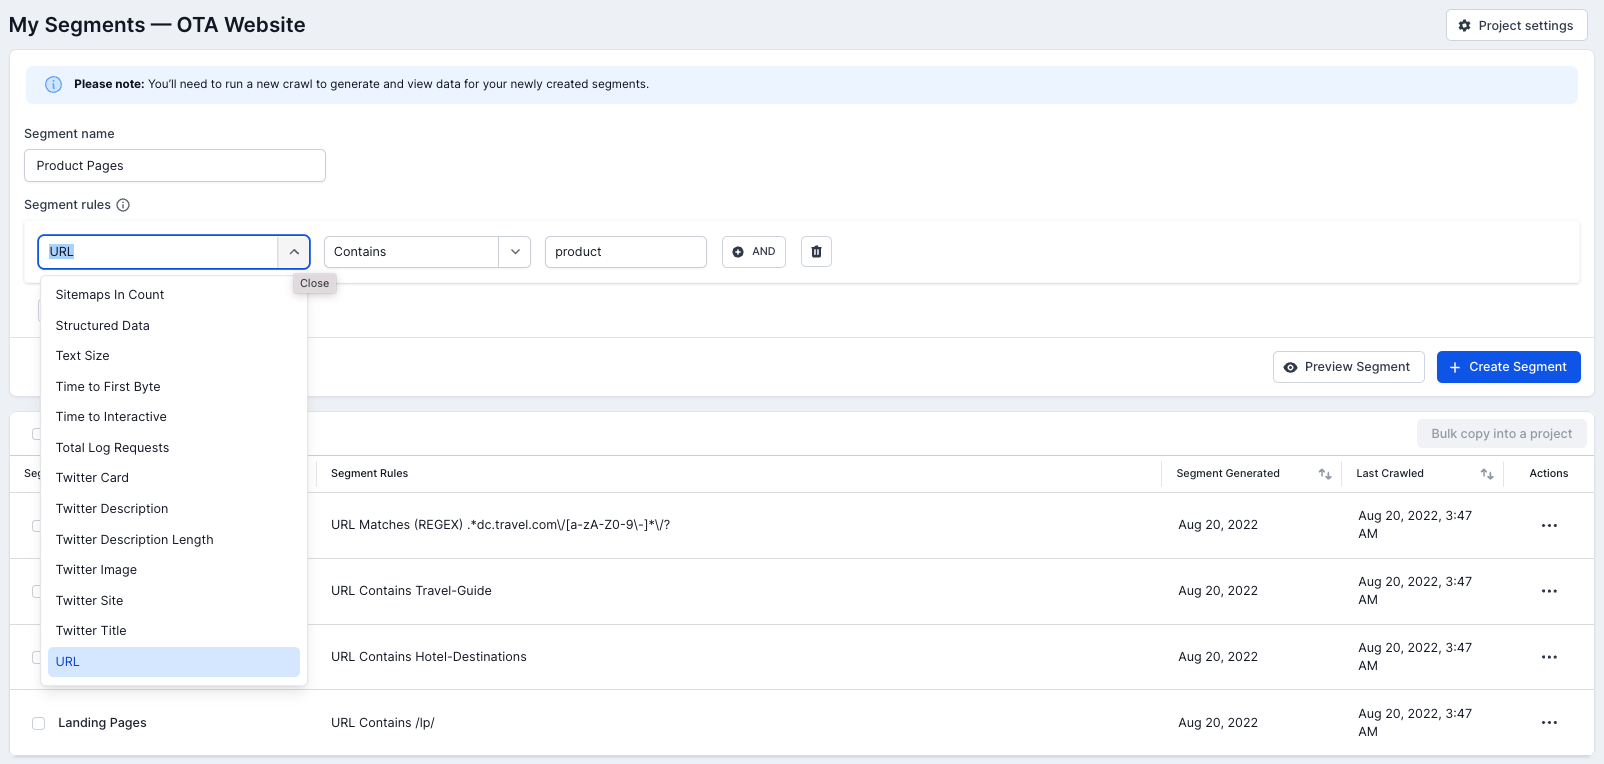
Give your segment a name and then add in the rules that you would like the segment to follow. You can also use And/Or rules to get the exact segment you need.
Once you’ve entered the rules, you can preview the segment to see a list of URLs that will appear in the segment. Once you’re happy with the details and results, click ‘Create Segment’ and the new segment will be added to My Segment page.
Editing, Copying & Deleting a Segment
To edit, copy or delete a segment, choose Manage Segments from the drop-down and you’ll be taken to the segment list. You can then click on the three dots at the very right hand side of the segment and choose either edit, copy or delete as required.
Crawling & Segmentation
Once you are happy with the segments you have created, then you must run a new crawl. To do this, click on ‘Project Settings’ in the top right corner to go to Step 4 in the crawl settings, and start the crawl. The segment will begin to generate once the new crawl has finished.
Note: You can create segments during the ‘crawling’ state and these will also be generated. However, if you create a segment during the ‘finalizing’ state, you will need to run a new crawl for the segment to generate.
Viewing Reports
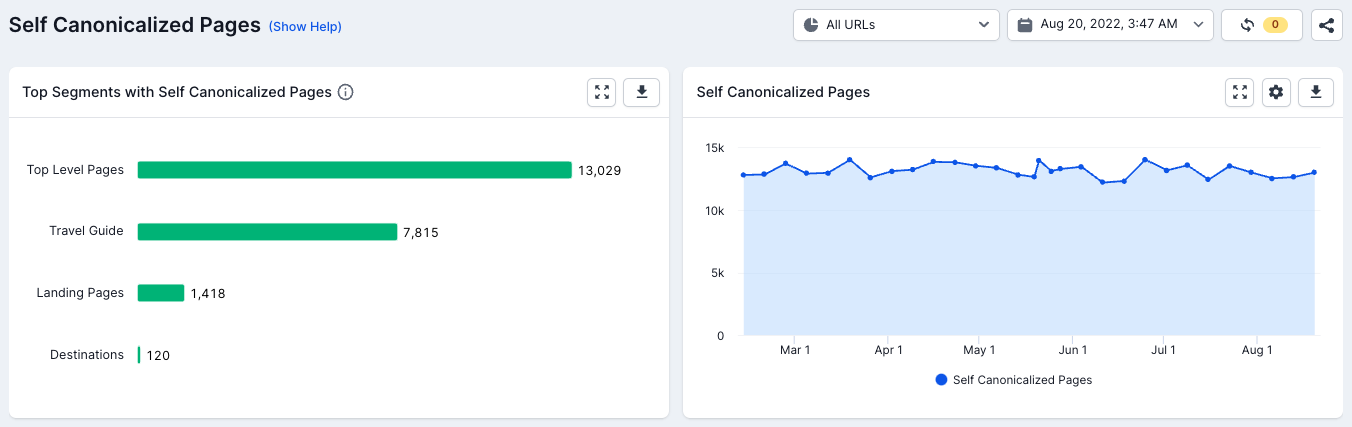
After you have run your crawl and your segments have been successfully generated, you can navigate back to “Reports” to view. You will initially be taken to reports that display the following data:
- Top segments in a report
- Trend graph
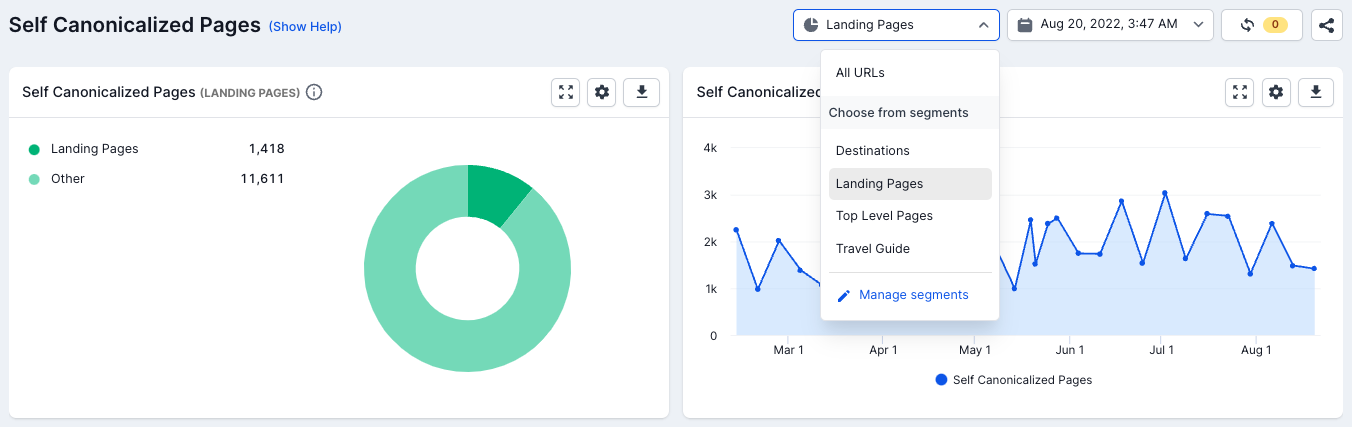
You can then select a specific segment by clicking the ‘All URLs’ option and choosing the segment you’d like to view. Once selected, the report will refresh showing you data only for that specific segment, based on the rules specified on creation.
The applied segment is also persistent, which means you can navigate to another report and the segment will still be applied. To remove the segmentation, just go back to the selector and choose another segment, or ‘All URLs’.
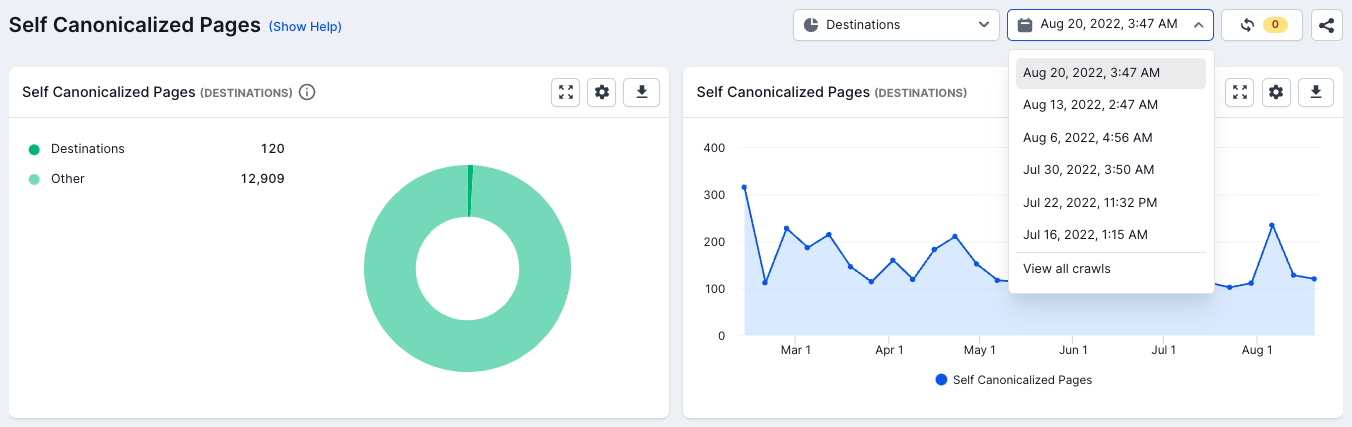
If the segment has been generated in past crawls then it will even persist when you switch to an unarchived historic crawl:
You can also apply additional filters on top of your segments:
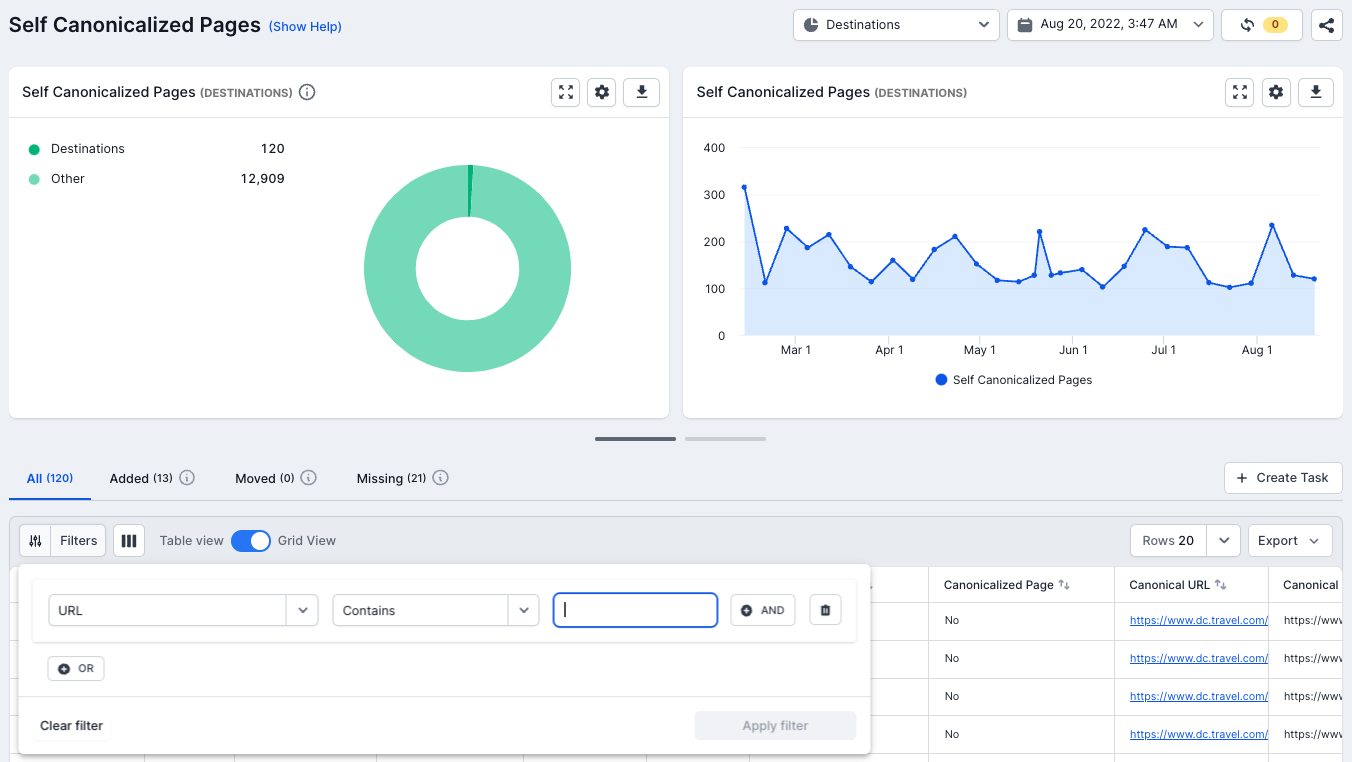
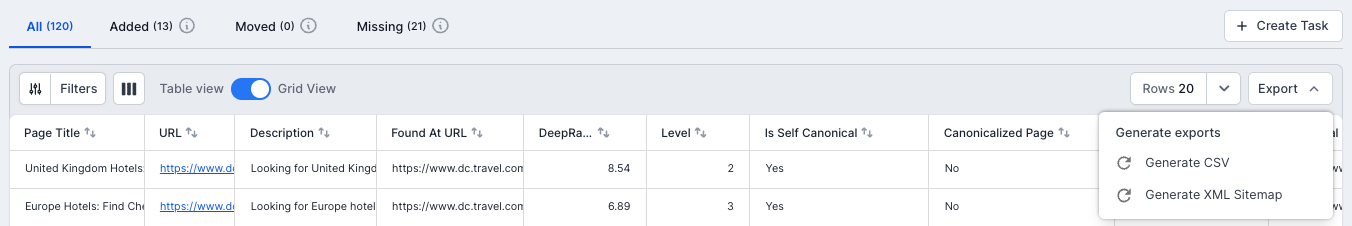
Exporting Segment Data
When a segment is applied, the data can be exported into a CSV file or XML sitemap. Simply click on ‘Export’ and choose to generate CSV or XML Sitemap. The file will then be downloaded to your browser.
Graphs
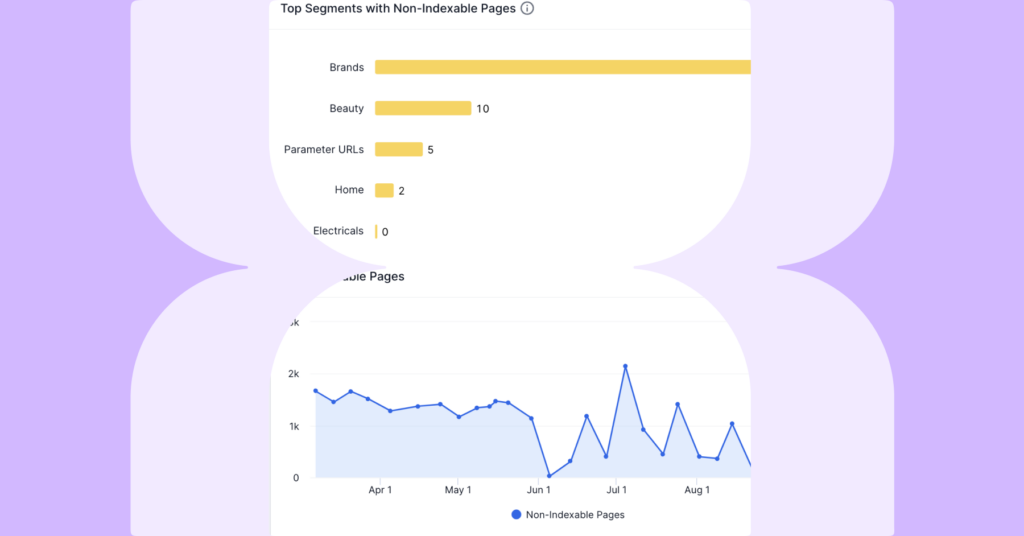
Top Segments graph: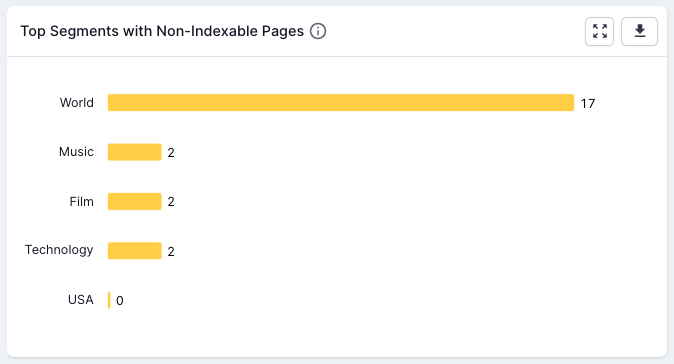
The Top Segments graph displays the top 5 segments that have the most URLs in a report. It can be used to quickly highlight problem areas of a website in any report.
The data points are clickable so you can simply click on any segment in the graph and it will take you to that segment in the report.
Segment Report Graph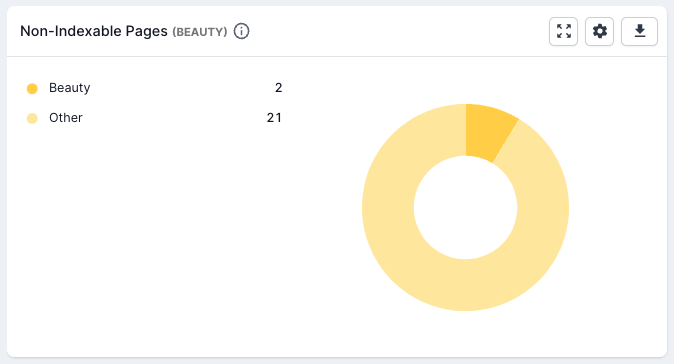
The segment report chart compares the currently selected segment URLs against all other URLs in this report. It allows you to see how big the URLs are within the context of the whole report.
If you have only created a handful of segments and these segments are quite small in the context of the rest of the pages in a report, then it indicates that more segments need to be created.
Trend Chart
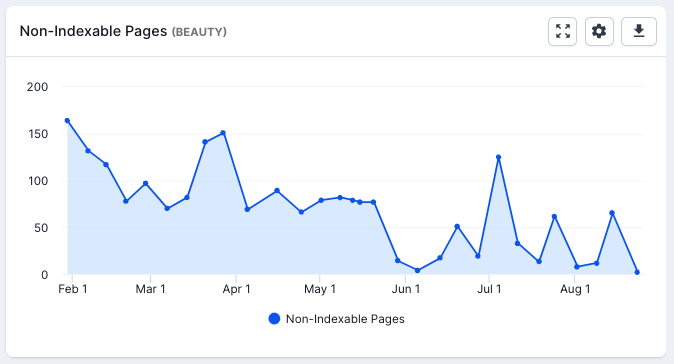
The trend chart maps out the data trends over historical crawls for any segment report. It can help you track improvements or issues for particular areas of the website, by spotting spikes or negative overall trends.
Copying Segments to Another Project
If you have multiple projects set up for the same website, you can bulk add the segments from one project to another. From the segment list, simply check the box of the segments you want to copy and click on the ‘Bulk copy into a project’ at the top right of the list. You’ll then be able to choose the project to copy them too.
RegEx validation
If you choose “Matches (RegEx)” and “Doesn’t Match (Regx)” rules, please enter Lucene valid regular expressions. Use Rubular to help write valid regular expressions. Forward slashes do not need to be escaped.


